FurtherAI Available in Microsoft Marketplace
Introducing Connectors



How Risk Engineers Aggregate Multi-Source Risk Data Into One Verifiable View

A risk engineer opens an account and finds five versions of the same building. The statement of values calls it Building C and says joisted masonry, 42,000 square feet. The inspection report from March calls it the West Annex and records masonry non-combustible. The engineering survey references a 2023 sprinkler upgrade that the SOV doesn't reflect. The loss run reports three claims against a location code that matches nothing in the schedule until someone reconciles it by address. And somewhere in a 40-message broker thread is a note that the annex was re-roofed last spring.
None of these documents is wrong, exactly. Each one is authoritative for something and unreliable for everything else. The work is deciding which source wins for which field, and being able to show why.
This guide covers the input side of that problem: how to reconcile SOVs, loss runs, inspection reports, engineering surveys, and broker correspondence into one risk record where every value traces back to the document it came from. What you do with that record afterwards, meaning the report, the scoring, and the audit file, is covered separately in our guide to automating risk assessment documentation.
Key takeaways
- A verifiable risk assessment is one where every field carries a citation: the document, the page, and the date it was valued. Anything without one is an assumption, whether a person or a model put it there.
- Reconciliation matters more than enrichment. Filling in missing property detail changed portfolio-level modelled loss by only 0.7% in one study of roughly 100,000 properties, while only about 13% of individual locations stayed within 5% of their original number.
- Precedence belongs to fields, not documents. The SOV wins on insured values. The inspection report wins on observed construction. Ranking whole documents against each other guarantees you'll be wrong somewhere.
- Risk engineers already work to a source-attribution discipline. ASTM E2018-24 sets out how property condition assessments should handle information provided by others, separately from what the consultant observed. Data lineage applies the same distinction at field level.
- Exposure growth explains more than 80% of the long-term rise in weather-related insured losses since 1970, according to Swiss Re Institute. Exposure data is the variable you can actually control.
What makes a risk assessment verifiable
Verifiable has a specific meaning here, and it isn't "accurate." An assessment is verifiable when someone who wasn't there can reconstruct how each value was arrived at, without asking you.
In practice that means every field in the risk record carries four things: the value, the source document, the location within that document, and the date the value was valid. Construction class isn't "ISO Class 4." It's ISO Class 4, from the inspection report, page 6, observed March 2026. Prior losses aren't "$412,000." They're $412,000 paid across three claims, from the loss run, page 2, valued February 2026, because the same claims will carry a different number when the reserves move.
This is not a new obligation invented for AI. Risk engineers already work under it. ASTM E2018-24, the standard guide for baseline property condition assessments, devotes a dedicated section to the verification of information provided by others, alongside separate provisions on accuracy and completeness. The distinction it draws, between what the consultant observed and what someone handed them, is the same distinction a data lineage field records. Source traceability was written for people with clipboards long before anyone was arguing about model provenance.
Regulators have since arrived at the same place for automated systems. The NAIC's Model Bulletin on the Use of Artificial Intelligence Systems by Insurers, now adopted in 25 jurisdictions, sets out what a regulator can ask for during a market conduct action or investigation: for the AI system under scrutiny, "the data source, provenance, data lineage, quality, integrity" of the data behind it. That's a standard you either meet in advance or fail in the moment. New York's Circular Letter No. 7 (2024) addresses the input side directly, expecting insurers to document "any ECDIS or other inputs and their sources," and advising that vendor contracts include audit rights over third-party data where appropriate and available. Once the data is aggregated, the compliance report built on it has its own audit requirements; see compliance software for risk engineers.
The practical test: if a regulator, a reinsurer, or your own claims department asks where a construction class came from three years from now, can you answer in one click or one week?
The five inputs, and what each is actually good for
Treat each source as a witness with a narrow area of competence.
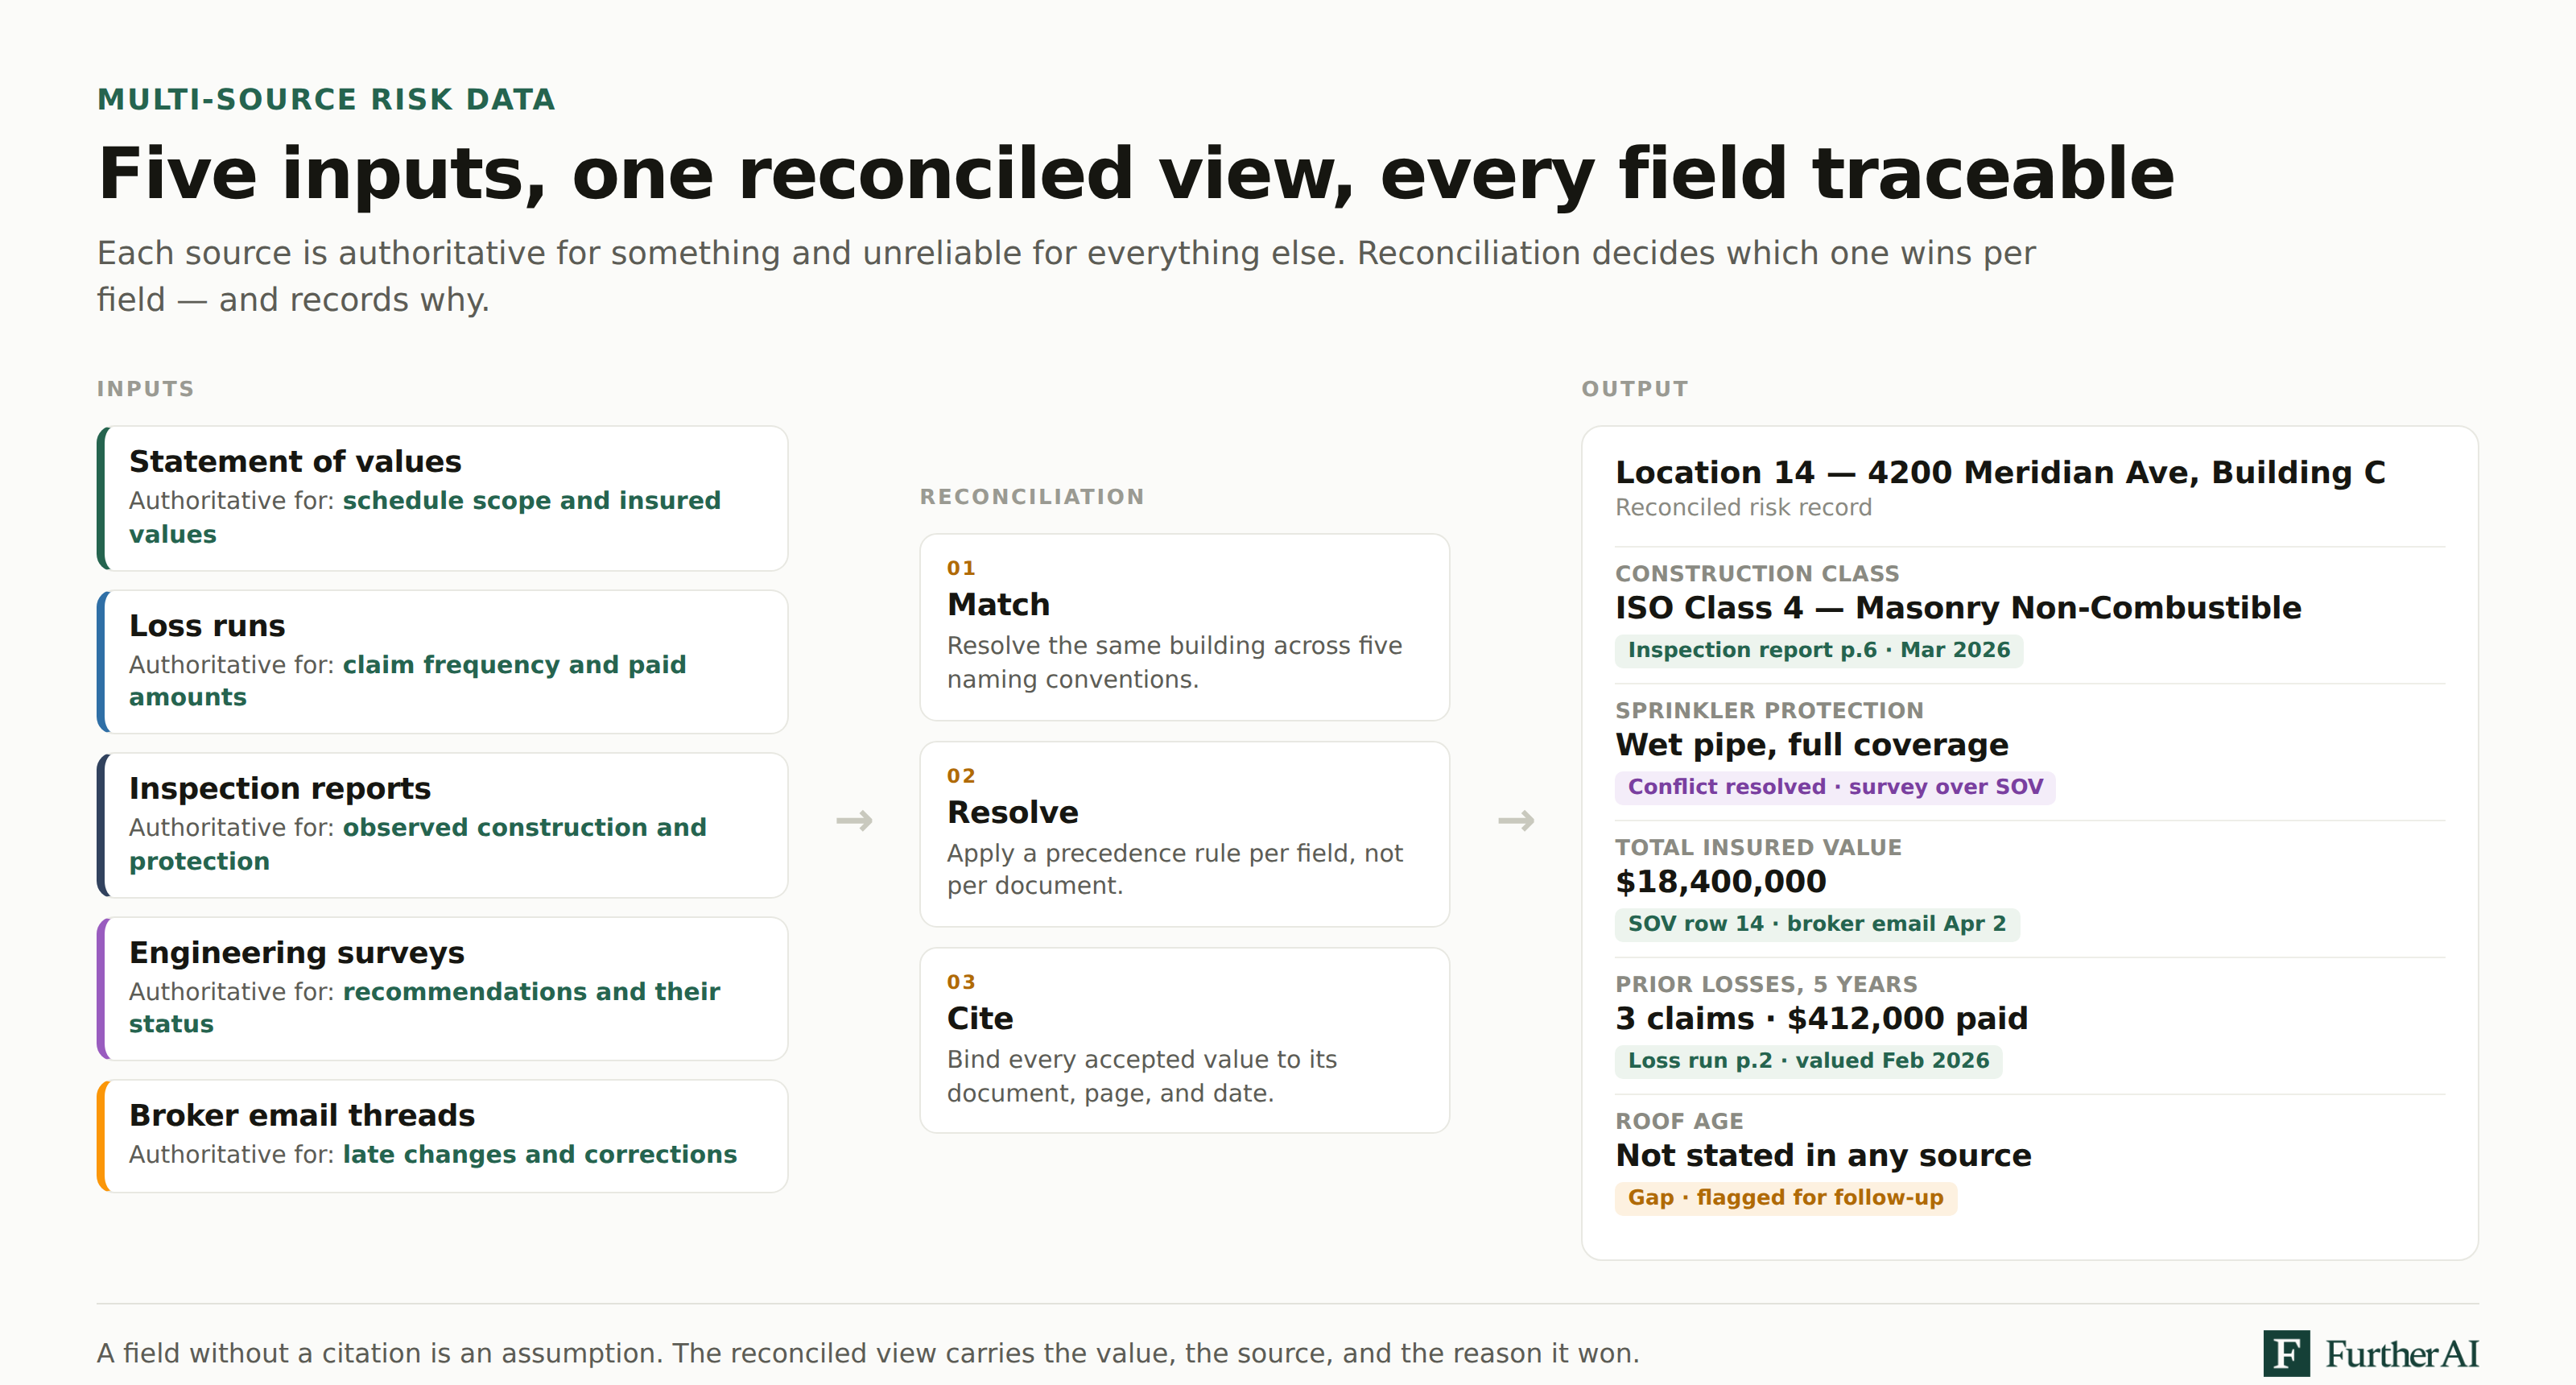
Statements of values
Authoritative for: the scope of the schedule and the insured values. It's the only document that tells you which locations are on the policy.
How it fails: it's assembled by the insured, often from a spreadsheet that has been copied forward for years. Construction and protection fields get defaulted, inherited, or left blank. Values drift out of date. Commercial reconstruction costs rose 4.1% in the year to July 2026 alone, per Verisk's 360Value analysis, and schedules rarely keep up. A Kroll study of property appraisals, reported by the Insurance Information Institute, found roughly 90% of studied buildings underinsured, with 68% of those valued in 2020–2021 underinsured by 25% or more.
What to check: which fields are populated versus defaulted, when the values were last reviewed, and whether location count reconciles to the prior term.
Loss runs
Authoritative for: claim frequency, paid amounts, and dates of loss.
How it fails: a loss run is a snapshot, not a fact. Reserves move, and the same accident year reports differently depending on the valuation date. US insurers recorded $7.30 billion of adverse one-year development in other liability (occurrence) business in 2025, with 43.3% of the total attaching to the three most recent accident years. Location coding across carriers is inconsistent, so claims frequently can't be tied to a schedule row. Entitlement to loss runs is regulated in some states. Oregon, for instance, requires insurers or their appointed producers of record to provide five years of loss runs within 15 calendar days, to prior commercial policyholders as well as current ones, prorated where the relationship is shorter. Nothing regulates their format.
What to check: the valuation date on every run, whether open claims carry current reserves, and how many claims you can actually map to a location.
Inspection reports
Authoritative for: observed physical characteristics. Construction, protection, housekeeping, condition.
How it fails: they age. A report from four years ago describes a building that may have been re-roofed, re-tenanted, or partially sprinklered since. Coverage is also partial, because most schedules have far more locations than anyone has ever visited.
What to check: the survey date against the SOV's last update, and whether the inspected location list covers your largest values or just the convenient ones.
Engineering surveys
Authoritative for: recommendations, their severity, and their completion status.
How it fails: the recommendation is captured; the closure often isn't. Carriers put real money behind closing that loop: FM doubled its resilience credit from 5% to 10% of eligible in-force premium in November 2025, roughly $825 million, to support client investment in resilience.
What to check: open versus closed status per recommendation, and whether any closure is evidenced or merely asserted.
Broker email threads
Authoritative for: late changes, corrections, and the things nobody put in a document.
How it fails: it isn't structured, it isn't searchable in any useful way, and the correction that matters is usually in the middle of a thread about something else. It is also the most likely place to find the single fact that invalidates a schedule field.
What to check: every message after the SOV's date stamp, and any attachment sent as a revision.
Why reconciliation matters more than enrichment
The instinct on seeing a thin SOV is to buy data — append construction, protection, and hazard attributes from an external source and move on. Enrichment helps, but the reason it helps is not the one most teams assume.
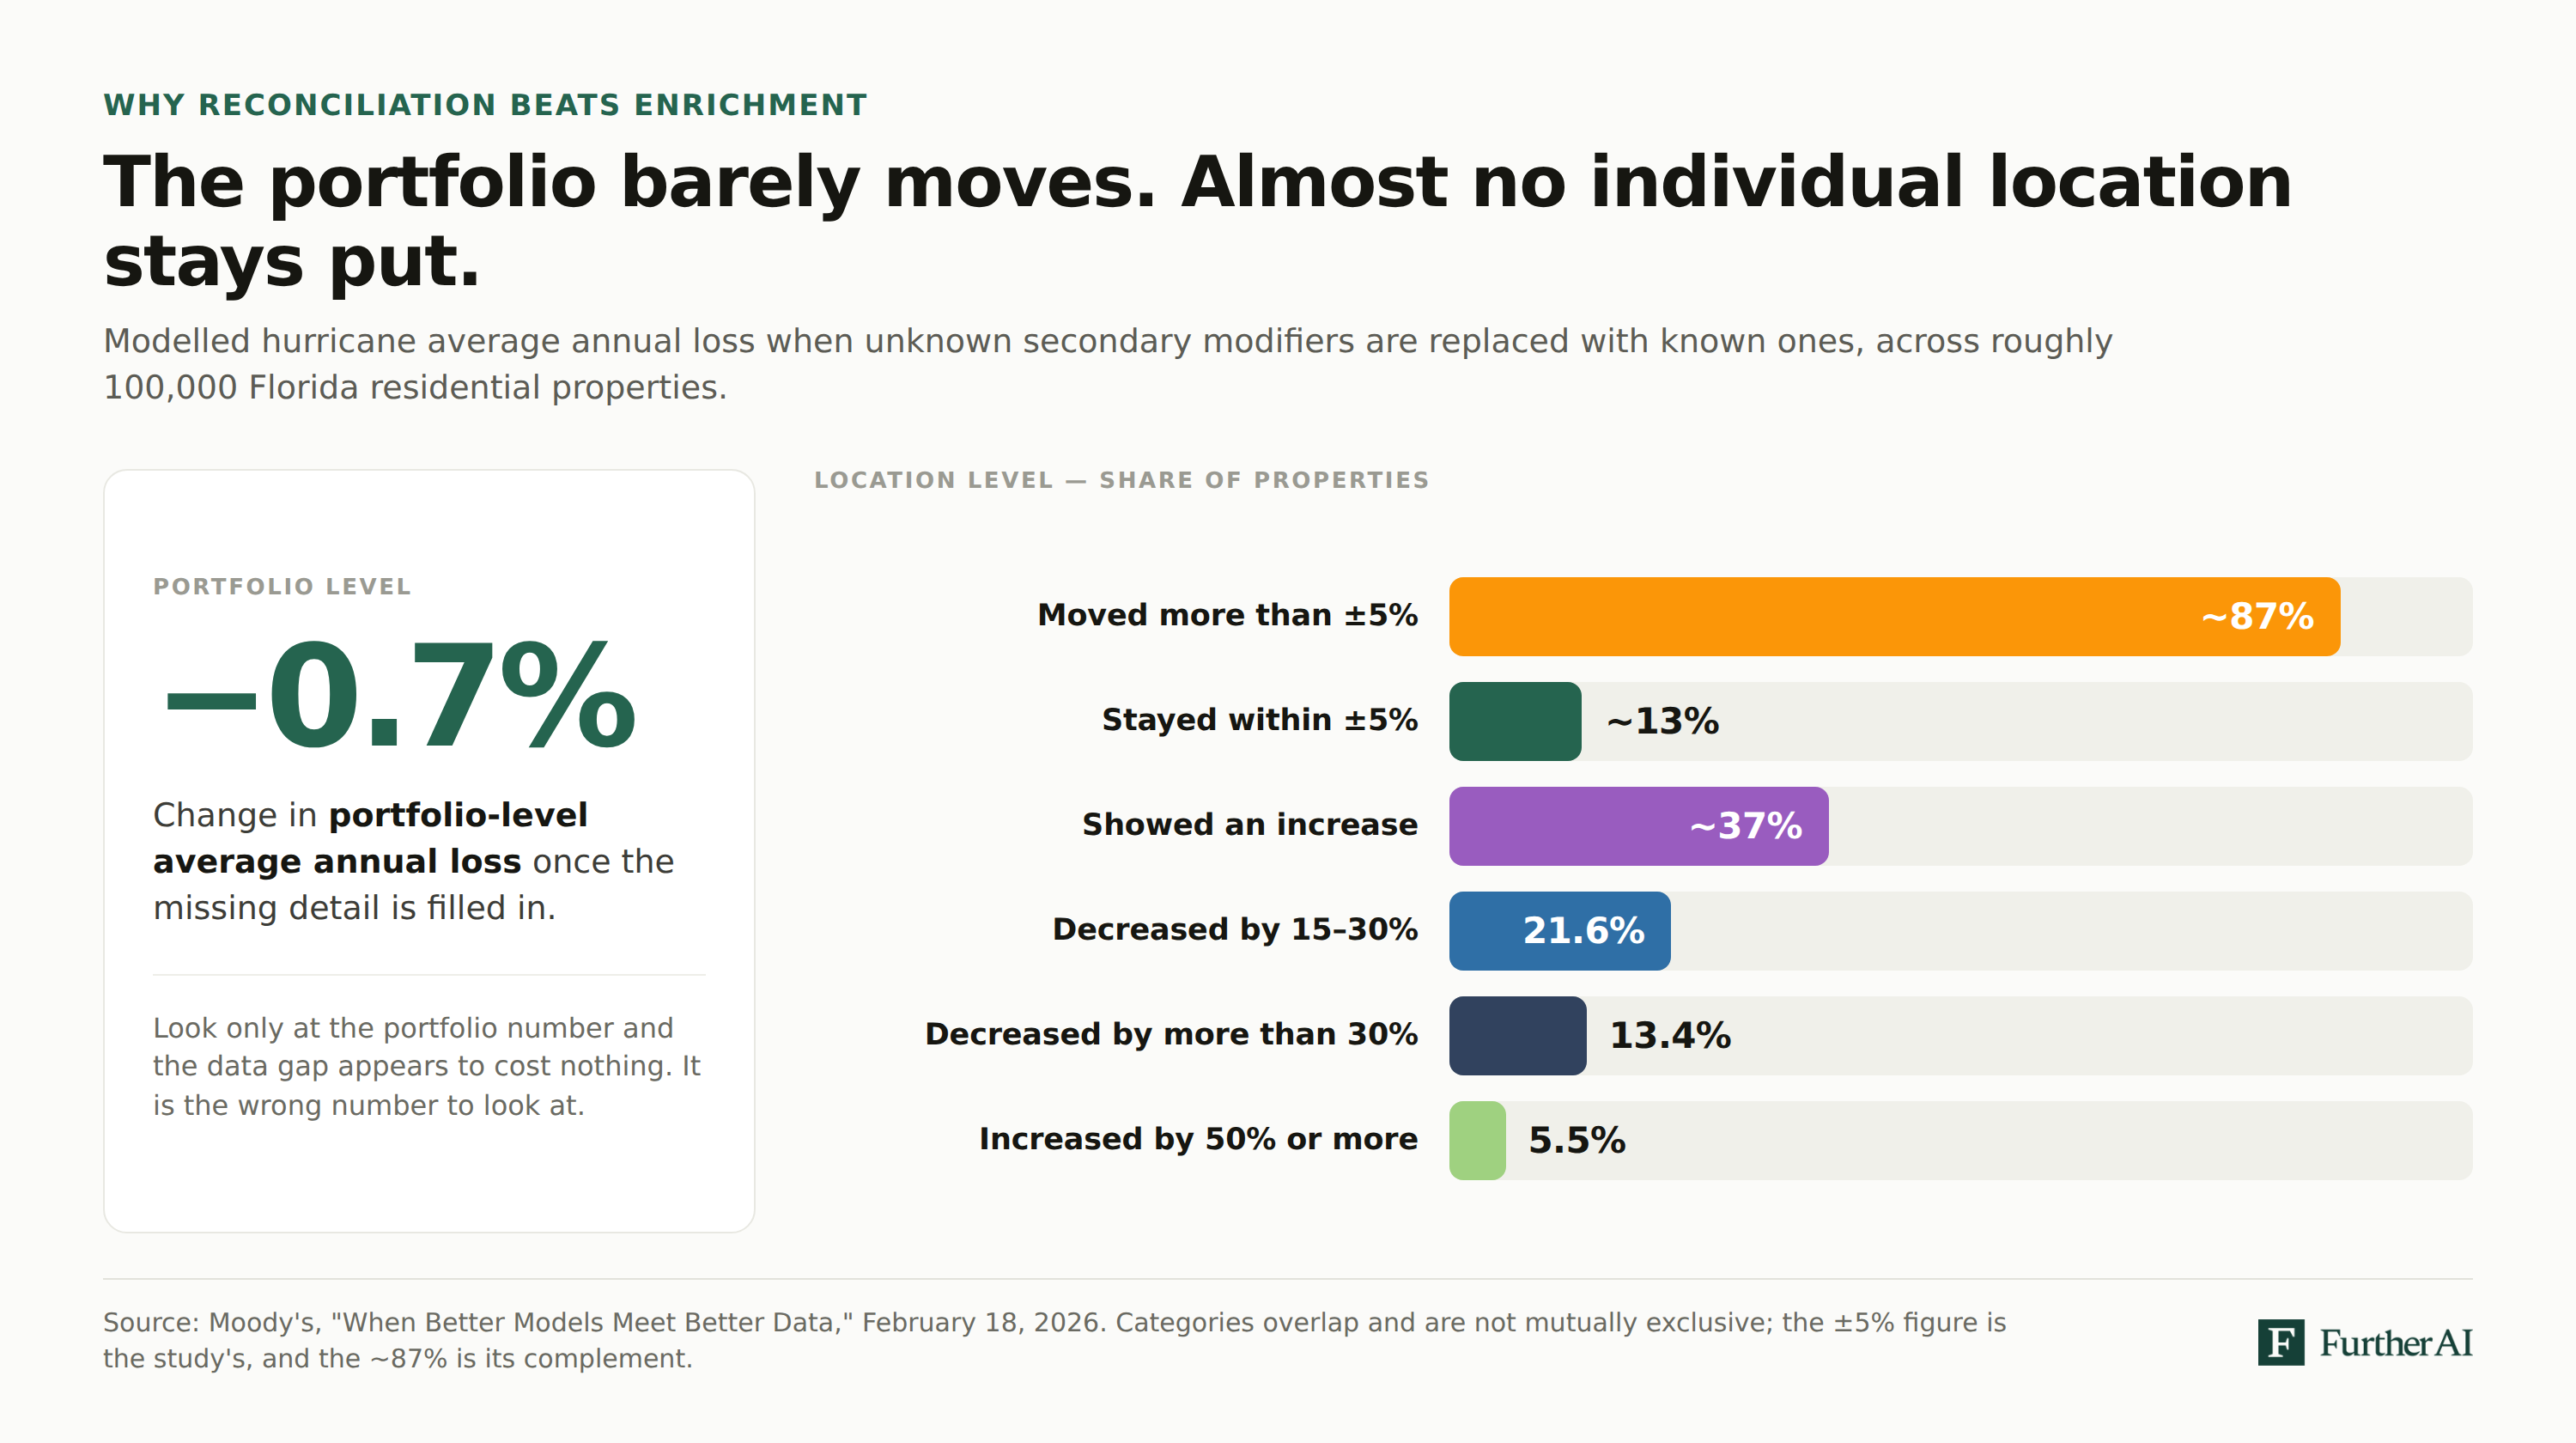
Moody's ran roughly 100,000 randomly selected Florida residential properties through a hurricane model twice: once with unknown secondary modifiers, once with known ones. The portfolio-level average annual loss moved by 0.7%, which is effectively nothing. But only around 13% of individual locations landed within 5% of where they started. About 37% went up, 5.5% of them by at least half. Meanwhile 21.6% fell by 15% to 30%, and another 13.4% fell by more than 30%.
Read that carefully, because it is the whole argument for location-level reconciliation. Missing property detail does not make a portfolio wrong on average. It makes almost every individual risk wrong, in both directions, and the errors net out to something that looks fine on a summary page. If you underwrite, price, or engineer at the location level, which is what risk engineers do, the portfolio number is telling you nothing.
The study is Florida residential, so treat the specific percentages as illustrative for a commercial schedule rather than transferable. The structural point holds: aggregate stability hides location-level noise.
That noise now costs more than it used to. Swiss Re Institute attributes more than 80% of the long-term global increase in weather-related insured losses since 1970 to exposure growth rather than to hazard change, which makes exposure data the controllable variable in the equation. And the pricing cushion that used to absorb bad data has thinned: Marsh reported global property rates down 12% in the second quarter of 2026, following 9% falls in each of the two preceding quarters, with US property down 13%.
A worked example: one account, five sources, four conflicts
A manufacturing account, 38 locations, $386 million total insured value. Here is Location 14 as each source describes it, and what a reconciled record concludes.
Four things happened in that table that a single-source workflow would have missed. The construction class changed, which moves the rate. The square footage changed by 13%, which moves the value. The sprinkler recommendation is closeable, which is worth credit to the insured and a corrected protection field to the modeller. And the roof age is genuinely unknown, recorded as a gap rather than quietly defaulted to a model assumption.
That last one matters most. A defaulted value and a verified value look identical in a database, and only one of them is defensible.
Check our dedicated article on compliance software for risk engineers for in-depth review of the topic.
The reconciliation workflow
Step 1: Normalize and match
Get every source into a common location key before comparing anything. Address is the usual anchor, but addresses are dirty, so match on a combination of geocode, area, and value bands rather than string equality. Expect the SOV, loss run, and survey to use three different naming conventions for the same building, and expect one location in twenty to be genuinely ambiguous.
Step 2: Set precedence per field, not per document
Write the precedence rules down before the account arrives. Observed physical characteristics come from the most recent physical inspection. Insured values come from the SOV as amended by broker correspondence. Loss history comes from the carrier loss run with the latest valuation date. Recommendation status comes from the survey, evidenced. Where the rule is genuinely close, the newer source wins and the conflict gets recorded.
Step 3: Resolve and record
Every accepted value gets its citation attached at the moment of resolution, not reconstructed afterwards. Every rejected value gets kept, not deleted. A conflict you resolved is evidence you looked, and it's what you'll want when someone challenges the file. This is also where extraction confidence belongs: a field pulled at 71% confidence and a field a human keyed should not be indistinguishable downstream.
Step 4: Flag gaps as gaps
The most valuable output of reconciliation is often the list of things no source answered. Roof age, secondary modifiers, business interruption dependencies, and equipment schedules go missing constantly. A reconciled record should carry an explicit "not stated" rather than a silent default, and that list becomes the follow-up request to the broker.
Step 5: Hand off
The reconciled record feeds the model, the pricing file, and the report. Because each field carries its source, the documentation step downstream inherits the citations instead of rebuilding them, which is the point at which this workflow meets risk assessment documentation.
What this looks like at scale
Reconciliation is tractable by hand for 20 locations and impossible for 20,000. One top-10 global carrier, with more than $20 billion in gross written premium, was spending one to five days processing a single SOV in a Large Property unit handling 300 to 800 files a month, with schedules running from 500 to 100,000 locations and up to 60 fields each. Address validation alone consumed one to two minutes of human time per location. Quote turnaround ran two to three weeks.
After automating extraction, validation, and enrichment across 32 property fields, end-to-end intake time fell under 10 minutes even for schedules above 50,000 locations, with field-level accuracy above 95% at go-live rising to 97% within six months, and a 646% return on investment.
The number worth focusing on there isn't the speed. It's the field-level accuracy figure, because it's the only one that tells you whether the reconciled record can be trusted, and because it's measured per field rather than per document. Ask any vendor for that breakdown specifically.
What to demand from a system
Five questions, in the order they matter:
- Can it cite? Every extracted field should return a document reference, a page or cell reference, and a valuation date. If citations are generated after the fact rather than captured at extraction, they aren't citations.
- Can it disagree with itself? The system should surface conflicts between sources rather than silently picking one. Ask to see the conflict log for a real account.
- Does it distinguish missing from zero? A blank sprinkler field and an unsprinklered building are opposite facts. Systems that collapse them are dangerous in a way that is hard to detect later.
- Is confidence exposed per field? A single document-level accuracy percentage tells you nothing about whether construction class specifically is reliable.
- Does the lineage survive export? Citations that exist only in the vendor's interface disappear the moment the data reaches your modelling platform.
Frequently asked questions
REFERENCES
ASTM International. "E2018-24: Standard Guide for Property Condition Assessments: Baseline Property Condition Assessment Process." ASTM International, 2024. store.astm.org
FM. "FM Announces Enhanced Resilience Credit of US$825 Million to Support Client Investment in Resilience." FM, November 6, 2025. newsroom.fmglobal.com
FurtherAI. "Complex Property SOV Intake." FurtherAI. furtheraicom
Independent Agent. "Verisk: Labor Costs Drive 4% Total Reconstruction Cost Increase." IA Magazine, August 20, 2026. iamagazine.com
Insurance Information Institute. "Commercial Property Insurance Shows Signs of Improvement, Stable Growth, Says New Triple-I Brief." Triple-I, December 19, 2024. iii.org
Marsh. "Global Commercial Insurance Rates Fall 6% in Q2 2026." Marsh, July 23, 2026. marsh.com
Moody's. "When Better Models Meet Better Data: Moody's Exposure Enrichment." Moody's, February 18, 2026. moodys.com
NAIC. "Adoption Map: Model Bulletin on the Use of Artificial Intelligence Systems by Insurers." National Association of Insurance Commissioners, August 6, 2026. content.naic.org
NAIC. "Model Bulletin on the Use of Artificial Intelligence Systems by Insurers." National Association of Insurance Commissioners, December 4, 2023. content.naic.org
New York State Department of Financial Services. "Insurance Circular Letter No. 7 (2024): Use of Artificial Intelligence Systems and External Consumer Data and Information Sources in Insurance Underwriting and Pricing." NYDFS, July 11, 2024. dfs.ny.gov
Oregon Secretary of State. "Oregon Administrative Rules 836-080-0810: Provision of Commercial Loss Runs." Oregon Administrative Rules. law.cornell.edu
Risk & Insurance. "Liability Insurers Face Unexpected Reserve Headwinds in Recent Years." Risk & Insurance, March 19, 2026. riskandinsurance.com
Swiss Re Institute. "Wildfires, Storms, Floods Contribute to Record 92% of Global Insured Losses in 2025." Swiss Re, March 19, 2026. swissre.com
DISCLAIMER
This article is for general informational purposes only and does not constitute legal, regulatory, compliance, underwriting, or other professional advice. The content reflects information available as of the date of publication, and FurtherAI undertakes no obligation to update it as laws, regulations, or AI technologies evolve.
Recent posts

Ready to go further and
transform your insurance ops?
Reclaim your time for strategic work and let our AI Assistant handle the busywork. Schedule a demo to see how you can achieve more, faster.




.svg)