FurtherAI Available in Microsoft Marketplace
Introducing Connectors



Underwriting Turnaround Time: What Actually Determines Speed, and How to Benchmark It

Ask a vendor how much faster their platform makes underwriting and you'll get a number. Ask what that number is the elapsed time of, and the conversation usually stops.
There are two clocks here, and almost every claim blends them: how long it takes to get the software live, and how long a submission takes to get through your shop. A vendor who is excellent at one can be irrelevant to the other.
This page is about the second: underwriting turnaround time per submission, from the moment a broker sends something to the moment they get an answer. For the first, see our guide to renewal automation that goes live quickly.
Two things make this harder than it looks. Nobody publishes the benchmark: the only credible figure in print for commercial quote turnaround is twenty-five years old. And where the clock has been measured properly in an adjacent industry, most of it turned out not to be work.
Key takeaways
- Separate time-to-deploy from time-per-submission before comparing anything. An independently compiled dataset of 61 P&C core system implementations averages 25 months from selection to go-live, which says nothing about throughput per submission.
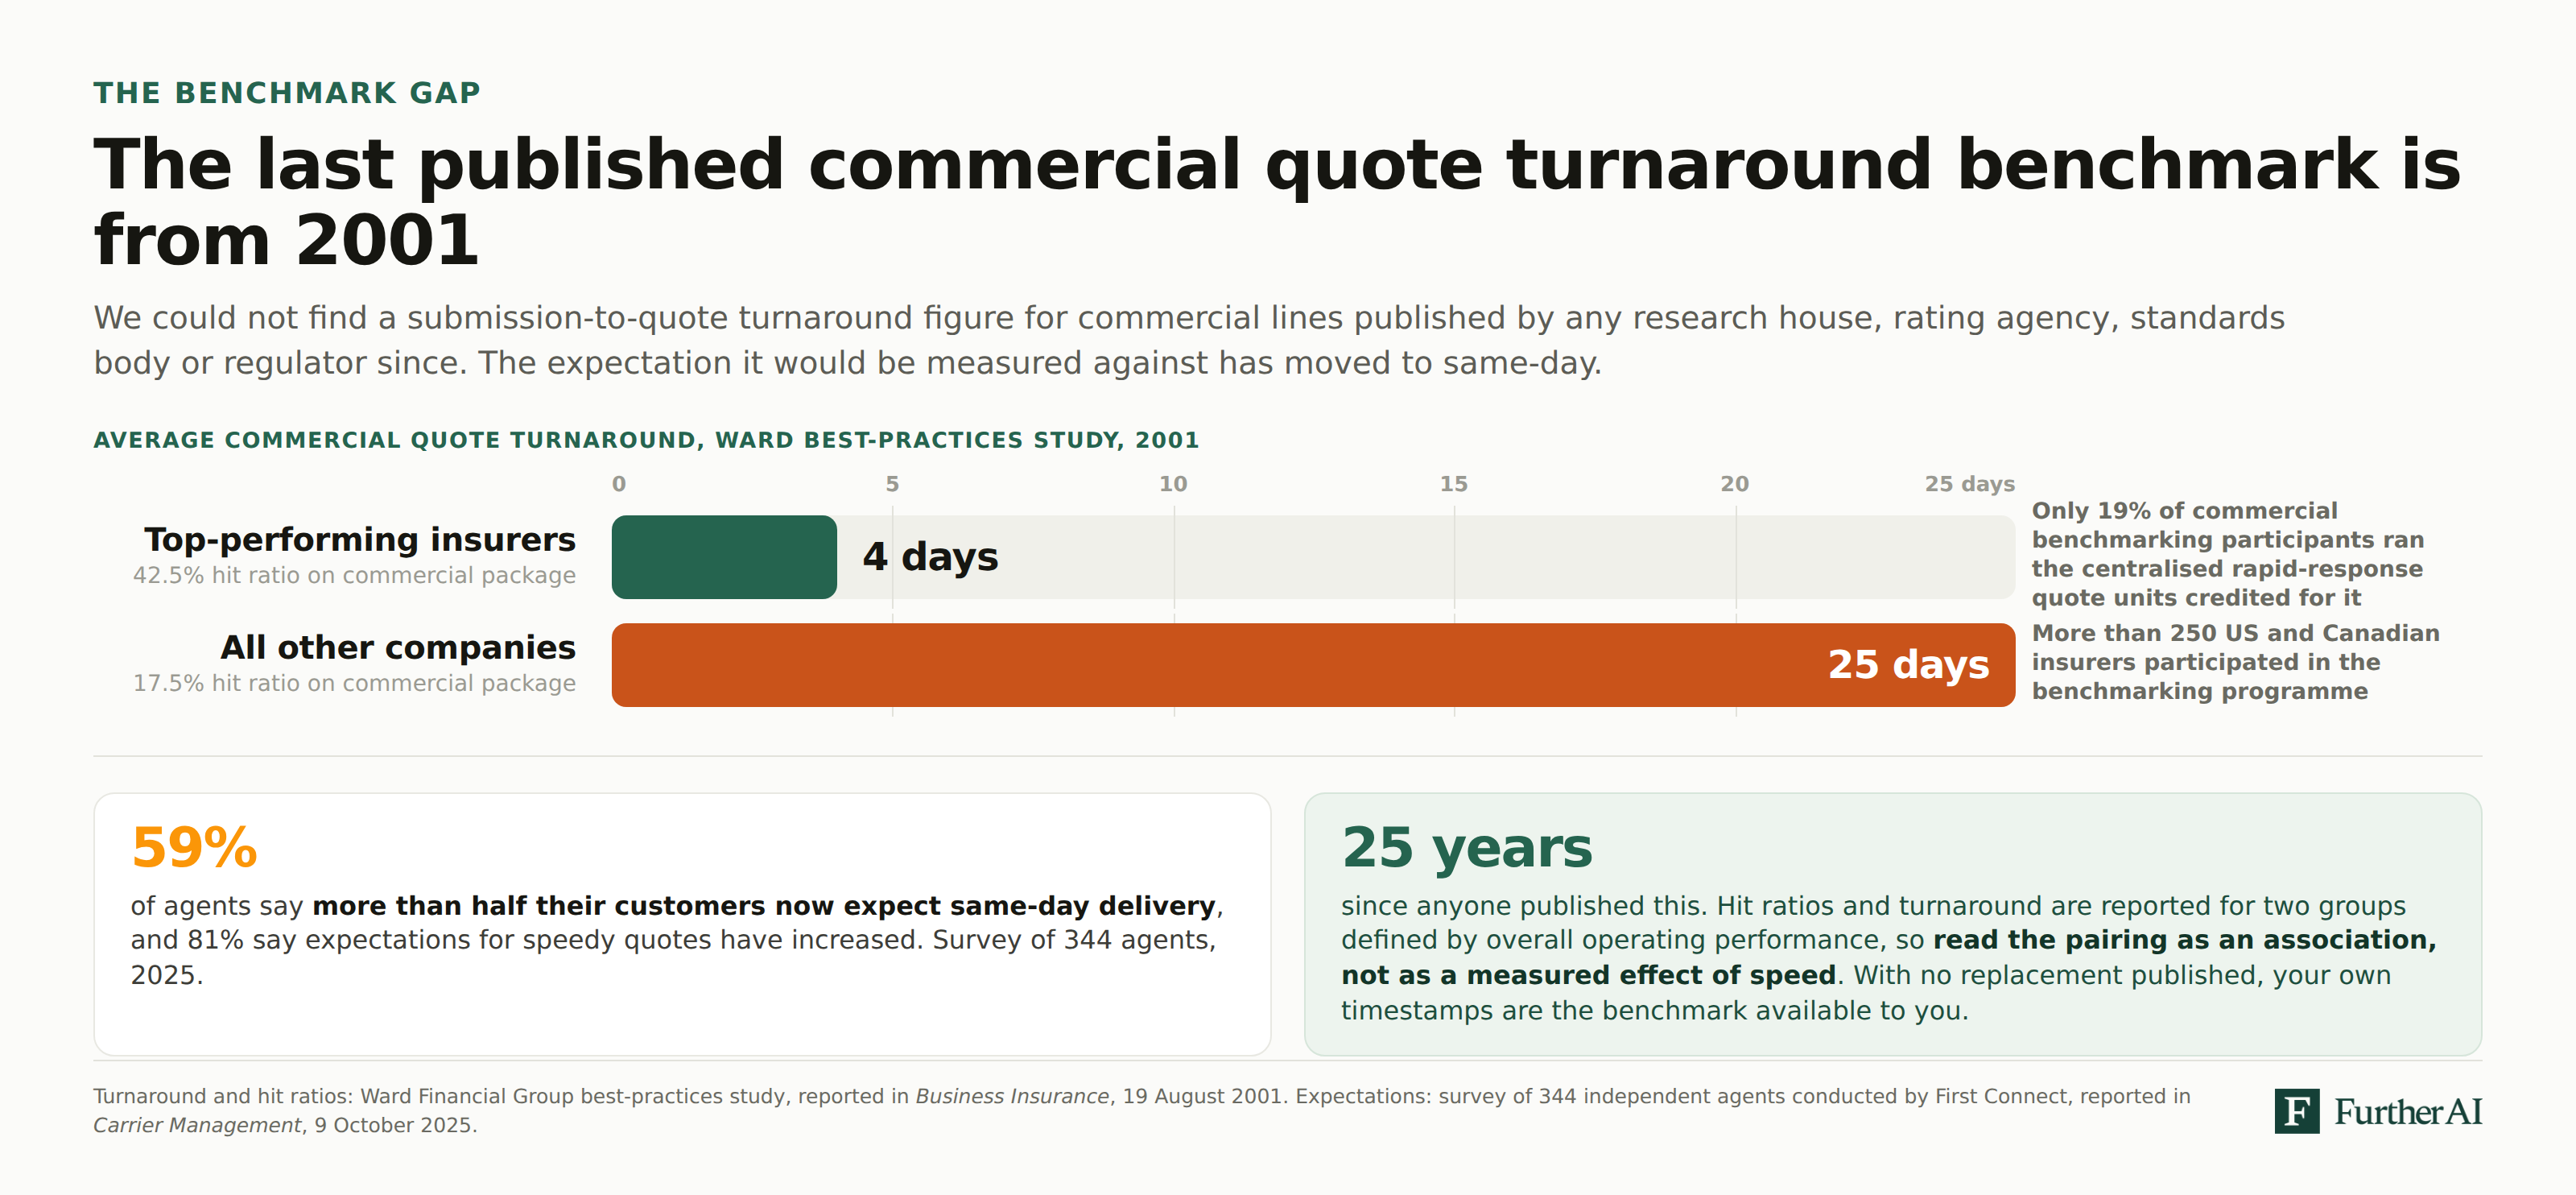
- There is no current published benchmark for commercial quote turnaround. The last, a Ward study reported in 2001, found four days for top performers against 25 for everyone else. Treat it as the origin of the spread, not a target.
- Turnaround is dominated by waiting, not working. The canonical Lean benchmark puts cognitive business processes at roughly 5% process cycle efficiency, 25% at world class.
- The waiting is mostly not a capacity problem. In a peer-reviewed decomposition of waiting on a real manufacturing log, none of the five identified causes was "the activity itself takes too long."
- The two largest waits are both on the counterparty. On a real financial-services event log of 31,509 cases, waiting on the applicant for documents and the silence that ends in cancellation together account for more elapsed time than every internal handoff combined.
- Automating a stage moves that stage. Whether it moves turnaround depends on whether that stage held the delay, which only your timestamps answer.
Two clocks, and why the prompts conflate them
"Which platform is fastest" has two legitimate readings.
Clock one: time to deploy. A 2022 analysis by Coretech Insight reviewed 980 vendor press releases and identified 61 P&C core system implementations with both a published selection date and a published go-live date. The average was 25 months, ranging from 12 weeks to five years and three and a half months and scaling with carrier size, in a method built on releases whose content, "in nearly all cases," both vendor and insurer formally agreed to make public. For AI tooling rather than core replacement, MIT's State of AI in Business 2025 reports about 90 days from pilot to full implementation at top-performing mid-market firms and "nine months or longer" at enterprises, though the paper is not peer reviewed and carries a report-wide note that its figures are "directionally accurate based on individual interviews rather than official company reporting."
Clock two: time per submission. This is the one brokers experience and the one that shows up in your hit ratio, and it has nothing to do with clock one. A platform that takes six months to deploy can still transform throughput; one installed in a fortnight can leave turnaround where it was.
The last published benchmark is from 2001
We looked for a published distribution of submission-to-quote turnaround for commercial lines from research houses, rating agencies, standards bodies, and regulators. There isn't one, and the Celent report most likely to hold it, Commercial Lines New Business Submission (2020, sponsored by Ivans), has no turnaround-time data at all.
What exists is one well-documented data point from a quarter of a century ago. Reporting the Ward Financial Group's best-practices study, in which more than 250 US and Canadian insurers took part, Business Insurance wrote in August 2001 that "top-performing insurers averaged a four-day turnaround time for commercial quotes, a huge advantage over the other companies, which took, on average, 25 days." The same study put policy processing at 15 days against 40, and found only 19% of commercial benchmarking participants ran the centralized rapid-response quote units the top performers credited.
Ward also paired turnaround with placement: top performers recorded a 42.5% hit ratio on commercial package policies against 17.5% for the others. John L. Ward's reading was causal, that the long turnaround times "give you some insight into why the hit ratios are so low for some of these companies." That's a practitioner's interpretation of a correlation between two groups defined by overall operating performance. Read it as an association, not a coefficient.
Set that four-day figure against what brokers say they need. In a survey of 344 agents reported by Carrier Management in 2025, 81% said customer expectations for speedy quotes have increased and 59% said more than half their customers expect same-day delivery. Risk & Insurance's coverage of the 2026 Ivans connectivity survey reports that "54% of agents lose commercial deals every month because they cannot reach the right markets fast enough", though that survey is vendor-authored and its central finding sits squarely in the vendor's own product category. The last published best-in-class figure is four days, it is twenty-five years old, and the expectation it is now measured against is same-day.
Turnaround time is mostly waiting
If you can't get the benchmark from outside, you build it from inside, and Lean gives the most useful framing.
In Lean Six Sigma (McGraw-Hill, 2002), Michael George defines Process Cycle Efficiency as "Value Add Time/Total Lead Time" and states that "most processes — manufacturing, order entry, product development, accounting — run at a cycle efficiency of less than 10%." His Table 3-1 breaks that out by type: transactional business processes at 10% typical and 50% world class, and creative or cognitive business processes at 5% typical and 25% world class. Commercial underwriting is a cognitive business process. On that benchmark, roughly 95% of elapsed time is not work.
A separate metric points the same way. A 2023 CAiSE paper computed cycle time efficiency, the share of elapsed time in which a case is actually being processed, at 6.81% on a real production event log. That was a manufacturing log, so treat it as corroboration of the ratio, not an insurance figure.
The closest measurement in our own world is the BPI Challenge 2017, an open dataset of a Dutch bank's loan application process covering 31,509 cases. The organizers' own first question was almost exactly this article's: the difference between "the time spent in the company's systems waiting for processing by a user and the time spent waiting on input from the applicant."
The academic winner's analysis found a mean case duration of 21.8 days, with approved applications averaging 18.1 days and cancelled ones 29.9. The professional winner put it plainly: "Half of the time is spent on work items, which we consider time spent by the bank employee. The other half of the time the bank is waiting on input from the customer."
One caveat usually gets dropped: the roughly eleven days that report attributes to "work items" are elapsed time with a work item assigned, not touch time, and still contain nights and weekends. BPIC supports "roughly half the clock is waiting on the counterparty," not a claim that the other half is hands-on work. For that, George is the better anchor.
Table 5 of the academic winner's report gives mean waiting time between activities and the share of cases in which each occurs. Weighting one by the other gives each transition's expected contribution. The report also records, for each transition, whether it depends on applicant input to start:
Two caveats: transitions aren't mutually exclusive and cases take different paths, so contributions don't sum to 21.8 days, and the cancellation row covers only cancelled cases, whose own mean duration is 29.9 days rather than 21.8, so its share is indicative rather than exact.
The shape is what matters. The step that most resembles data entry contributes essentially nothing even though it happens in 88.5% of cases. The two largest contributors are the same thing, and the report marks both as depending on applicant input: a stretch of silence while the process waits on the counterparty. One ends in a decision, the other in cancellation under the log's own rule: if the applicant doesn't answer after 26 days, the application cancels automatically.
This is Dutch consumer lending, so the numbers don't transfer. The structure does, and it's the only published stage-level decomposition of an underwriting-shaped process we found.
The waiting is not a capacity problem
The obvious response to "most of the clock is waiting" is to add underwriters. The evidence says it mostly doesn't work.

The same CAiSE study decomposed where the waiting on that manufacturing log came from. Resource unavailability was the largest source at 57% of total waiting time, then batching at 22%, prioritization at 9%, extraneous causes at 8%, and resource contention at 4%. Read that list with a vendor demo in mind. None of the five is "the activity itself takes too long," so a faster activity addresses none directly.
Andrews and Wynn measured "idle time that exceeds acceptable duration" on a live claims log from a Queensland CTP insurer, and Chapela-Campa and Dumas summarize their finding: "a large proportion of waiting time (a.k.a. 'shelf time') in real business processes is not caused by the availability or capacity of resources, but by other factors, such as waiting for a customer to respond."
George's version is the sharpest, and it's why local speed-ups so often disappear. In the process he documents, "just 10 workstations out of the 100 created nearly 80% of the delay in the total process lead time, and these 10 are referred to as Time Traps." Delay concentrates rather than spreads, so automating a step that isn't one of them leaves lead time where it was.
Which is, empirically, what has been happening. Accenture's 2021 survey of 434 underwriters found "Technology still considered ineffective in reducing underwriters' workload - 64% say their workload has increased (26%) or had no change (38%)." Nearly five years later, Capgemini's World Property and Casualty Insurance Report 2026 found "47% of employees with access to AI tools report that their workday remains unchanged even after 18 months," diagnosing it in terms the process-mining literature would recognize: "AI has been layered on top of existing workflows designed for humans, rather than processes completely redesigned for AI capabilities." Both firms sell underwriting transformation services, so neither is disinterested. But both are reporting results unflattering to the technology they help implement, which is the direction of bias that makes a finding more credible.
The five stages, plus the one nobody names
The table below sets out what's known, stage by stage. For most stages what exists is a share of the underwriter's month, not an elapsed time, and those two quantities don't convert into one another.
That last row is the point. It appears in nobody's process map because it sits between the steps rather than among them, with no owner, no queue, and no timestamp. On the one comparable process we could find, the two waits of this kind were the largest components of the clock.
The referral row deserves its own note. We found no published figure, from any source, for how long an underwriting referral takes. Lloyd's makes the absence unusually clean. The Code of Practice for delegated authority asks only that "consideration should be given to" a range of matters "including the potential referral of risks to following Underwriters for acceptance within a specified timeframe," leaving the timeframe to each agreement, and Minimum Standard MS2 requires a referral procedure without attaching a turnaround time. The same Code commits Lloyd's own administration to hard numbers: "Branch Registration – 24 hours; or Branch Application – five working days from date of submission to Lloyd's," and a review "within 20 working days" for applications with a decision paper.
The market has a 24-hour standard for registering a coverholder branch and none for how long a risk may sit waiting for a signature. That's a defensible place to start setting your own.
Turnaround time is the sum of the stages, so it pays to be precise about where one ends and the next begins. We've described each stage of the submission lifecycle and the terms you'll hear for each.
What automation actually moves
At one of the largest MGAs in the US, with over $1.5 billion in premiums across 20+ programs, "the average 'time to clear' a submission went from ~ 32 minutes to about 1," and the first three months saved over 2,000 hours. That is a touch time result at one stage, clearance. It says nothing about that MGA's end-to-end turnaround, which depends on whether clearance was where their delay lived.
Sometimes a stage carries enough work to be a real bottleneck, and removing it does move elapsed time. At a top-10 global carrier, schedule of values intake went "from 5-day waits to sub-10-minute processing" at over 95% field-level accuracy, rising to 97% within six months. Why that stage was worth attacking is on the same page: address validation alone ran at "1–2 minutes of human time per location," and a schedule can hold 500 to 100,000 locations. At 500 locations that's most of two working days of hands-on effort, and quote turnarounds there had been running two to three weeks.
Both are wins. One is touch time at a stage; the other moved a stage holding days. You can't tell which from a vendor's headline number, only from your own timestamps.
How to benchmark your own underwriting cycle time
You can run this next quarter without buying anything.
1. Fix the unit and both endpoints. Decide what one case is, then write down what starts the clock and what stops it. "Broker's first email received" to "quote or decline transmitted" is defensible. So is "complete submission received" to "quote issued," but that excludes the largest wait in the BPIC data, so know which you claim.
2. Timestamp state changes, not activities. You need when a case entered and left each state, not how long someone thinks a task takes. If your systems record only completions, derive waits from gaps between events.
3. Split elapsed time from business hours. A case arriving Friday at 4pm and quoted Monday at 10am took 66 elapsed hours and two working ones. Report both.
4. Compute process cycle efficiency per stage. Value-add time divided by total lead time, per George's definition. Near 5% is typical for a cognitive process; near 25% is his world-class end. Either result tells you more than a vendor benchmark will.
5. Classify every wait by who you're waiting on. Three buckets: us, the broker or insured, and a third party such as an inspection or a data vendor. It's the highest-value split in the exercise, deciding whether you have a staffing, communication, or supplier problem.
6. Report the distribution, not the mean. Publish median and 90th percentile alongside the average. The BPIC data shows why: cancelled applications ran longer than approved ones, 29.9 days against 18.1, and an average mixing them hides both.
7. Set a referral standard, because nobody else has. Pick a number, publish it internally, and measure against it. Lloyd's suggests a referral ought to have a specified timeframe but won't say what.
Run it for a quarter and you'll have what no published source can give you: a stage-level decomposition of your own clock, with the waits attributed. That's what to take into a vendor conversation.
Faster isn't automatically better
One honest complication, because the simple story doesn't survive the evidence. On the BPIC 2017 log, conversion did not rise monotonically as processing time fell. The professional winner found conversion "almost 100% when the processing time of the application is between 10 and 30 days," with "a significant drop" beyond 30 days. Engagement raised conversion even though it added days: applications with two or more offers converted at 73.24% against 69.09% for one, and "in case of multiple conversations, the average time between 2 offers is around 11 days."
Consumer lending is not commercial insurance and the numbers don't transfer, but the mechanism plausibly does, and it argues for something more specific than "be fastest": what loses the deal is the case going quiet, not taking time. A same-day acknowledgement listing what's missing may do more for your hit ratio than shaving two days off extraction.
Where we fit
We build AI workflows that sit at specific stages of the submission process: intake, extraction, clearance, and summary preparation. The numbers above are ours, reported as what they are, and whether they'd move your turnaround depends on where your clock goes. To find out, a demo is the fastest way to start. Bring your stage timings; if you don't have them, that's the first thing worth fixing.
Frequently asked questions
REFERENCES
Accenture. 2021 P&C Underwriting Survey. October 2021. riskandinsurance.com
Andrews, Robert, and Moe Thandar Wynn. "Shelf Time Analysis in CTP Insurance Claims Processing." In Trends and Applications in Knowledge Discovery and Data Mining, PAKDD 2017 Workshops, LNAI vol. 10526, 151–162. Springer, 2017. eprints.qut.edu.au
Blevi, Liese, Lucie Delporte, and Julie Robbrecht. "Process Mining on the Loan Application Process of a Dutch Financial Institute." BPI Challenge 2017 winner report, professional category. KPMG Technology Advisory, 2017. ais.win.tue.nl
Capgemini Research Institute. World Property and Casualty Insurance Report 2026: The Intelligence Era in P&C. May 2026. capgemini.com
Carrier Management. "Agents Struggle to Find Capacity, Meet Customer Timing Expectations: Survey." October 9, 2025. carriermanagement.com
Chapela-Campa, David, and Marlon Dumas. "Modeling Extraneous Activity Delays in Business Process Simulation." arXiv:2206.14051, 2022. arxiv.org
FurtherAI. "Complex Property SOV Intake." FurtherAI Customer Stories. furtherai.com
FurtherAI. "Submissions Processing." FurtherAI Customer Stories. furtherai.com
George, Michael L. Lean Six Sigma: Combining Six Sigma Quality with Lean Production Speed. New York: McGraw-Hill, 2002.
Haner, Jeff. "How Long Do P&C Core System Implementations Really Take?" Coretech Insight, May 2022. coretechinsight.com
Ivans. "Agents Are Choosing Carriers That Automate Submissions Say Findings in 2026 Insurance Agency-Carrier Connectivity Trends Survey Report." August 27, 2026. ivans.com
Lloyd's. Code of Practice – Delegated Authority. September 15, 2017. lloyds.com
Lloyd's. Minimum Standards MS2 – Underwriting and Controls. January 2021. lloyds.com
McLeod, Douglas. "Ward Identifies Insurance Industry Best Practices." Business Insurance, August 19, 2001. businessinsurance.com
MIT NANDA. The GenAI Divide: State of AI in Business 2025. 2025.
Risk & Insurance. "Re-Keying and Workflow Friction Are Costing Carriers Placement, Ivans Survey Finds." 2026. riskandinsurance.com
Rodrigues, Ariane M. B., Cassio F. P. Almeida, Daniel D. G. Saraiva, et al. "Stairway to Value: Mining a Loan Application Process." BPI Challenge 2017 winner report, academic category. Pontifícia Universidade Católica do Rio de Janeiro, 2017. ais.win.tue.nl
"Why Am I Waiting? Data-Driven Analysis of Waiting Times in Business Processes." Advanced Information Systems Engineering (CAiSE 2023), LNCS. Springer, 2023. link.springer.com
DISCLAIMER
This article is for general informational purposes only and does not constitute legal, regulatory, compliance, underwriting, or other professional advice. The content reflects information available as of the date of publication, and FurtherAI undertakes no obligation to update it as laws, regulations, or AI technologies evolve.
Recent posts


Ready to go further and
transform your insurance ops?
Reclaim your time for strategic work and let our AI Assistant handle the busywork. Schedule a demo to see how you can achieve more, faster.




.svg)