FurtherAI Available in Microsoft Marketplace
Introducing Connectors



Underwriting Summary Accuracy: How to Measure It Before You Buy

Every vendor selling automated underwriting summaries will quote you an accuracy number. Most of them are somewhere between 95% and 99%, and are usually measured on a few dozen documents the vendor chose.
While the number is appealing, it's also meaningless in a specific, fixable way. Accuracy is a ratio, so it depends entirely on four things a demo rarely states: which fields were counted, what counted as correct, which documents were used, and who decided the right answer.
This article publishes the method rather than the claim. You'll get a way to build a gold set, a rule for choosing metrics field by field, a bake-off protocol that works across vendors, honest figures for what accuracy is achievable on which document types, and a scorecard you can reuse. Everything here is designed to be run by your team against any vendor, including us.
Proving a decision after the fact is a different discipline, and we cover it separately in our guide to underwriting summaries with audit capabilities. This page is about measurement before you sign.
Key takeaways
- Per-field accuracy overstates how often a summary is right. On a 32-field summary, 97% per-field accuracy implies roughly 38% fully correct if errors were independent. Ask for the all-fields-correct rate, and agree what unit you're counting.
- A 50-document test resolves almost nothing. At an observed 95%, the 95% confidence interval runs from 85.1% to 98.4%. Distinguishing a 92% vendor from a 96% one takes roughly 540 documents.
- Different fields need different metrics. A missed exclusion costs you recall; a confident wrong total insured value is worse than a blank. Evaluation practice has let you weigh the two differently for more than thirty years.
- Noisy labels make accuracy uninterpretable. In the closest published analogue, two trained annotators agreed around 0.92 on well-defined identifiers and around 0.85 on interpretive judgments. Measure your own agreement before reading anything into a per-field score.
- Test the system, not the model. On one benchmark of 150 human-reviewed cases, the same model swung from 19% to 79% correct depending only on how documents were fed to it.
Why one accuracy number can't be used
Start with arithmetic that almost never appears in a sales conversation.
An underwriting summary is not one prediction: it's dozens of them, and the file is only usable if they're all right. If a system is accurate on each field with probability p, and there are k fields, the share of summaries with every field correct is p raised to the power k. For a summary carrying 32 fields:
One caveat, and it cuts in the buyer's favour: field errors are not independent. A bad scan or an unusual form breaks many fields at once, which concentrates errors in fewer documents and pushes the real all-correct rate above the table. Treat these figures as the pessimistic bound rather than a prediction.
Then pick a unit that matches the document, because the same underlying performance produces very different headline numbers depending on what you count. Our own complex property SOV case study reports over 95% field-level accuracy at go-live, rising to 97% within six months, at a top-10 global carrier. A schedule of values is not a 32-field object: the same page describes SOVs "often containing 500 to 100,000 global locations, each with up to 60 data fields," which puts a 500-location schedule at roughly 30,000 field values. All-fields-correct is a meaningless target at that scale, and per-location pass rate is the measure that means something. Settle the unit before you compare anyone.
Independent work shows how far units can diverge. In ExtractBench, a 2026 benchmark of PDF-to-JSON extraction across 35 documents and 12,867 evaluatable fields, models scored 72.9% accuracy counting only the extractions that produced valid JSON, against 4.6% across all field evaluations once invalid outputs count as failures. That aggregate is dominated by a single 369-field financial reporting schema on which no tested model produced valid output at all; excluding it, the pass rate is 28.0%. The authors caution that the valid-only figure "is computed on a biased sample" of easier cases, and the benchmark is authored by a vendor with a system in the comparison.
To get 90% of 32-field summaries fully correct, per-field accuracy has to reach 99.67%. That is the number worth negotiating about.
Step 1: Build the gold set
A gold set is a sample of your real documents with the correct answer recorded for every field you care about. It's the only thing that makes an accuracy claim checkable, and building one is the part most teams skip.
Sample by provenance, not by quality score
Stratify by where the document came from: digital PDF, scanner output, phone photograph, fax, email body. These categories are observable at intake and they predict outcomes.
Resist the temptation to stratify by an automated image-quality score. Recent work on document image quality assessment found "minimal variance in the quality scores between images as indicated by the NR-IQA models" while "OCR accuracy scores from both Keras OCR and Paddle OCR models exhibit significant variability." Two images its quality models both rated poor returned character recognition of 95% and 73%. The paper's own conclusion is that document-specific, OCR-oriented quality metrics need to be built. Until you have one, general perceptual quality scores won't predict extraction accuracy, so stratify by provenance instead.
Label twice, then adjudicate
The method used in the closest published analogue, medical NLP gold-standard construction, is double annotation: "All documents were double-annotated by two annotators, and disagreements were resolved during 'consensus sessions.'" The authors note that agreement "fluctuates even after the training period," which is "an argument in favor of double-annotation, to reduce cases of mislabeling and build stronger gold standards."
That study also reports the ceiling you're working against. Inter-annotator agreement was highest for well-defined identifiers, at an F-measure of 0.9176, because these are "well-defined entities, less ambiguous than most medical entities." For interpretive categories it fell to between 0.8467 and 0.8875.
The insurance analogue is untested, and no one has published agreement figures for insurance document review, but it's hard to argue with. Two underwriters reading the same ACORD 125 will agree closely on policy number, effective date, and building value. They will agree less on whether an operation counts as heavy manufacturing, or whether a clause is an exclusion. Low agreement on a field tells you the label itself is noisy, and accuracy measured against a noisy label is depressed and hard to interpret whichever vendor you test. Measure your own agreement first, or you will mistake label noise for model error.
For the wider point that expert judgment varies more than anyone expects, a noise audit of one insurer by Kahneman, Sibony, and Sunstein, summarised in strategy+business, found "the median difference in the pricing determined by its underwriters for identical policies was 55 percent." Separately, 828 senior executives across industries put their median expectation for variation in expert judgment at 10%. Pricing is a harder task than reading a field off a form, so treat that spread as context rather than as your gold-set ceiling.
How many documents
This is where most evaluations quietly fail. Accuracy is a proportion, and proportions measured near 1.0 need larger samples than intuition suggests.
Use the Wilson score interval rather than the textbook normal approximation. Agresti and Coull report that the normal approximation "performs poorly unless n is quite large": averaged across all true values of p, a nominally 95% Wald interval at n=5 achieves 64.1% coverage, against 95.5% for the score interval. They note separately that the Wald interval is "especially inadequate when p is near 0 or 1," which is the region accuracy testing lives in.
At an observed accuracy of 95%, different test-set sizes buy you very different certainty:
A 50-document demo scoring 95% is consistent with true accuracy anywhere from 85% to 98%. Two vendors scoring 92% and 96% on 50 documents have overlapping intervals and are statistically indistinguishable. Separating them takes around 540 documents if each is judged against its own interval. Score both on the same documents and you can detect the difference sooner, because a paired comparison cancels most of the sampling noise, which is one more reason the bake-off uses identical inputs.

Clinical prediction-model guidance lands in the same range. Whittle and colleagues calculate that a 95% confidence interval of width 0.1 requires about 385 observations for accuracy and 423 for positive predictive value. Their figures are derived for a specific clinical model and depend on prevalence, so use them as an order-of-magnitude anchor: hundreds per field type, not dozens.
None of this makes small test sets useless. They are good at catching regressions, because comparing version A against version B on the same documents removes most of the sampling noise. They are poor at estimating absolute accuracy, which is what a purchase decision needs.
Step 2: Choose a metric for each field type
"Accuracy" collapses two different failures. The evaluation literature separated them decades ago.
The MUC-5 evaluation metrics define recall as "the percentage of possible answers which were correct" and precision as "the percentage of actual answers given which were correct," and explicitly make the weighting an application decision: "Recall and precision can have relative weights in the calculation of the F-measure, giving it the flexibility to be useful in the context of different application requirements." The heading "P&2R" is for recall twice as important as precision; "2P&R" is for recall half as important.
That maps onto underwriting once you're careful about which failure is which. A missed flood exclusion costs you recall, so weight that field toward recall. A wrong total insured value costs you both, because the gold value went unfound and a wrong value was returned, but a confident wrong number is worse than a blank, so weight that field toward precision and score fabrications separately. Set the weighting per field before you test, and write it down.
Two failure modes need to be scored separately rather than netted off. In extraction evaluation, when the gold answer has a value and the system returns nothing, that's an omission; when the gold answer is null and the system returns a value, that's a fabrication. MUC-3 introduced an "overgeneration" measure precisely to stop systems from gaming recall by guessing at every field.
The mirror image is gaming precision by abstaining. In FinanceBench, across 150 human-reviewed cases, one configuration refused 68% of questions and was incorrect on only 13%. A precision score computed over answered questions alone would have flattered it badly. Score blanks and refusals explicitly.
A workable default assignment, with the field-type taxonomy adapted from ExtractBench:
Record a tolerance for every quantity. "Within 1% of the gold value" and "exact to the dollar" produce very different accuracy numbers on the same system, and a vendor who isn't asked will pick the generous one.
Step 3: Run the bake-off
Give every vendor identical inputs. The same documents, the same schema, the same field definitions, the same tolerances. If one vendor gets to preprocess and another doesn't, you're measuring the preprocessing.
Hold back a blind set. Share a tuning set and keep a portion sealed. Score the sealed set only once, at the end. The NIST AI Risk Management Framework recommends the analogous separation of people: under MEASURE 1.3, "Internal experts who did not serve as front-line developers for the system and/or independent assessors are involved in regular assessments…," and it adds that, "ideally," those carrying out verification and validation "are distinct from those who perform test and evaluation actions." Sealing a document set is the data-side equivalent.
Score the system, not the model. FinanceBench found the same model swinging from 19% to 79% correct depending only on how documents were fed to it, with the best result coming from long context rather than retrieval. FinanceBench is authored by a vendor. Whatever a vendor tells you about their underlying model matters far less than how their pipeline handles your documents. A study of 120 scanned financial documents in KYC workflows, whose authors present their own pipeline, makes the same point through ablations: removing page retrieval cost 24.0 percentage points and removing image preprocessing cost 16.3, while removing structured prompting cost 2.9.
These benchmarks are themselves small, at 35, 120, and 150 documents. The interval arithmetic above applies to them too, which is why they are worth citing for direction and not for absolute levels.
Report the all-fields-correct rate alongside per-field accuracy. Both numbers, every time, against the unit you settled on.
Re-run after any change. Model behaviour shifts between versions. Chen, Zaharia, and Zou found "the performance and behavior of both GPT-3.5 and GPT-4 can vary greatly over time" across seven task types between March and June 2023. Make re-running the eval a contractual event tied to any model or pipeline change, not an annual review item.
Ask what the vendor tested on. EIOPA's 2025 opinion on AI governance states that undertakings "should obtain adequate information and assurances from third-party service providers about the characteristics, capabilities, data used to train and test the AI systems, and the limitations of the AI systems used." That's a regulator giving you permission to ask for the vendor's own test set.
What accuracy is realistic
Published benchmarks cluster on clean, well-structured documents, which is why vendors quote them. Real submissions are messier, and accuracy tracks document type closely.
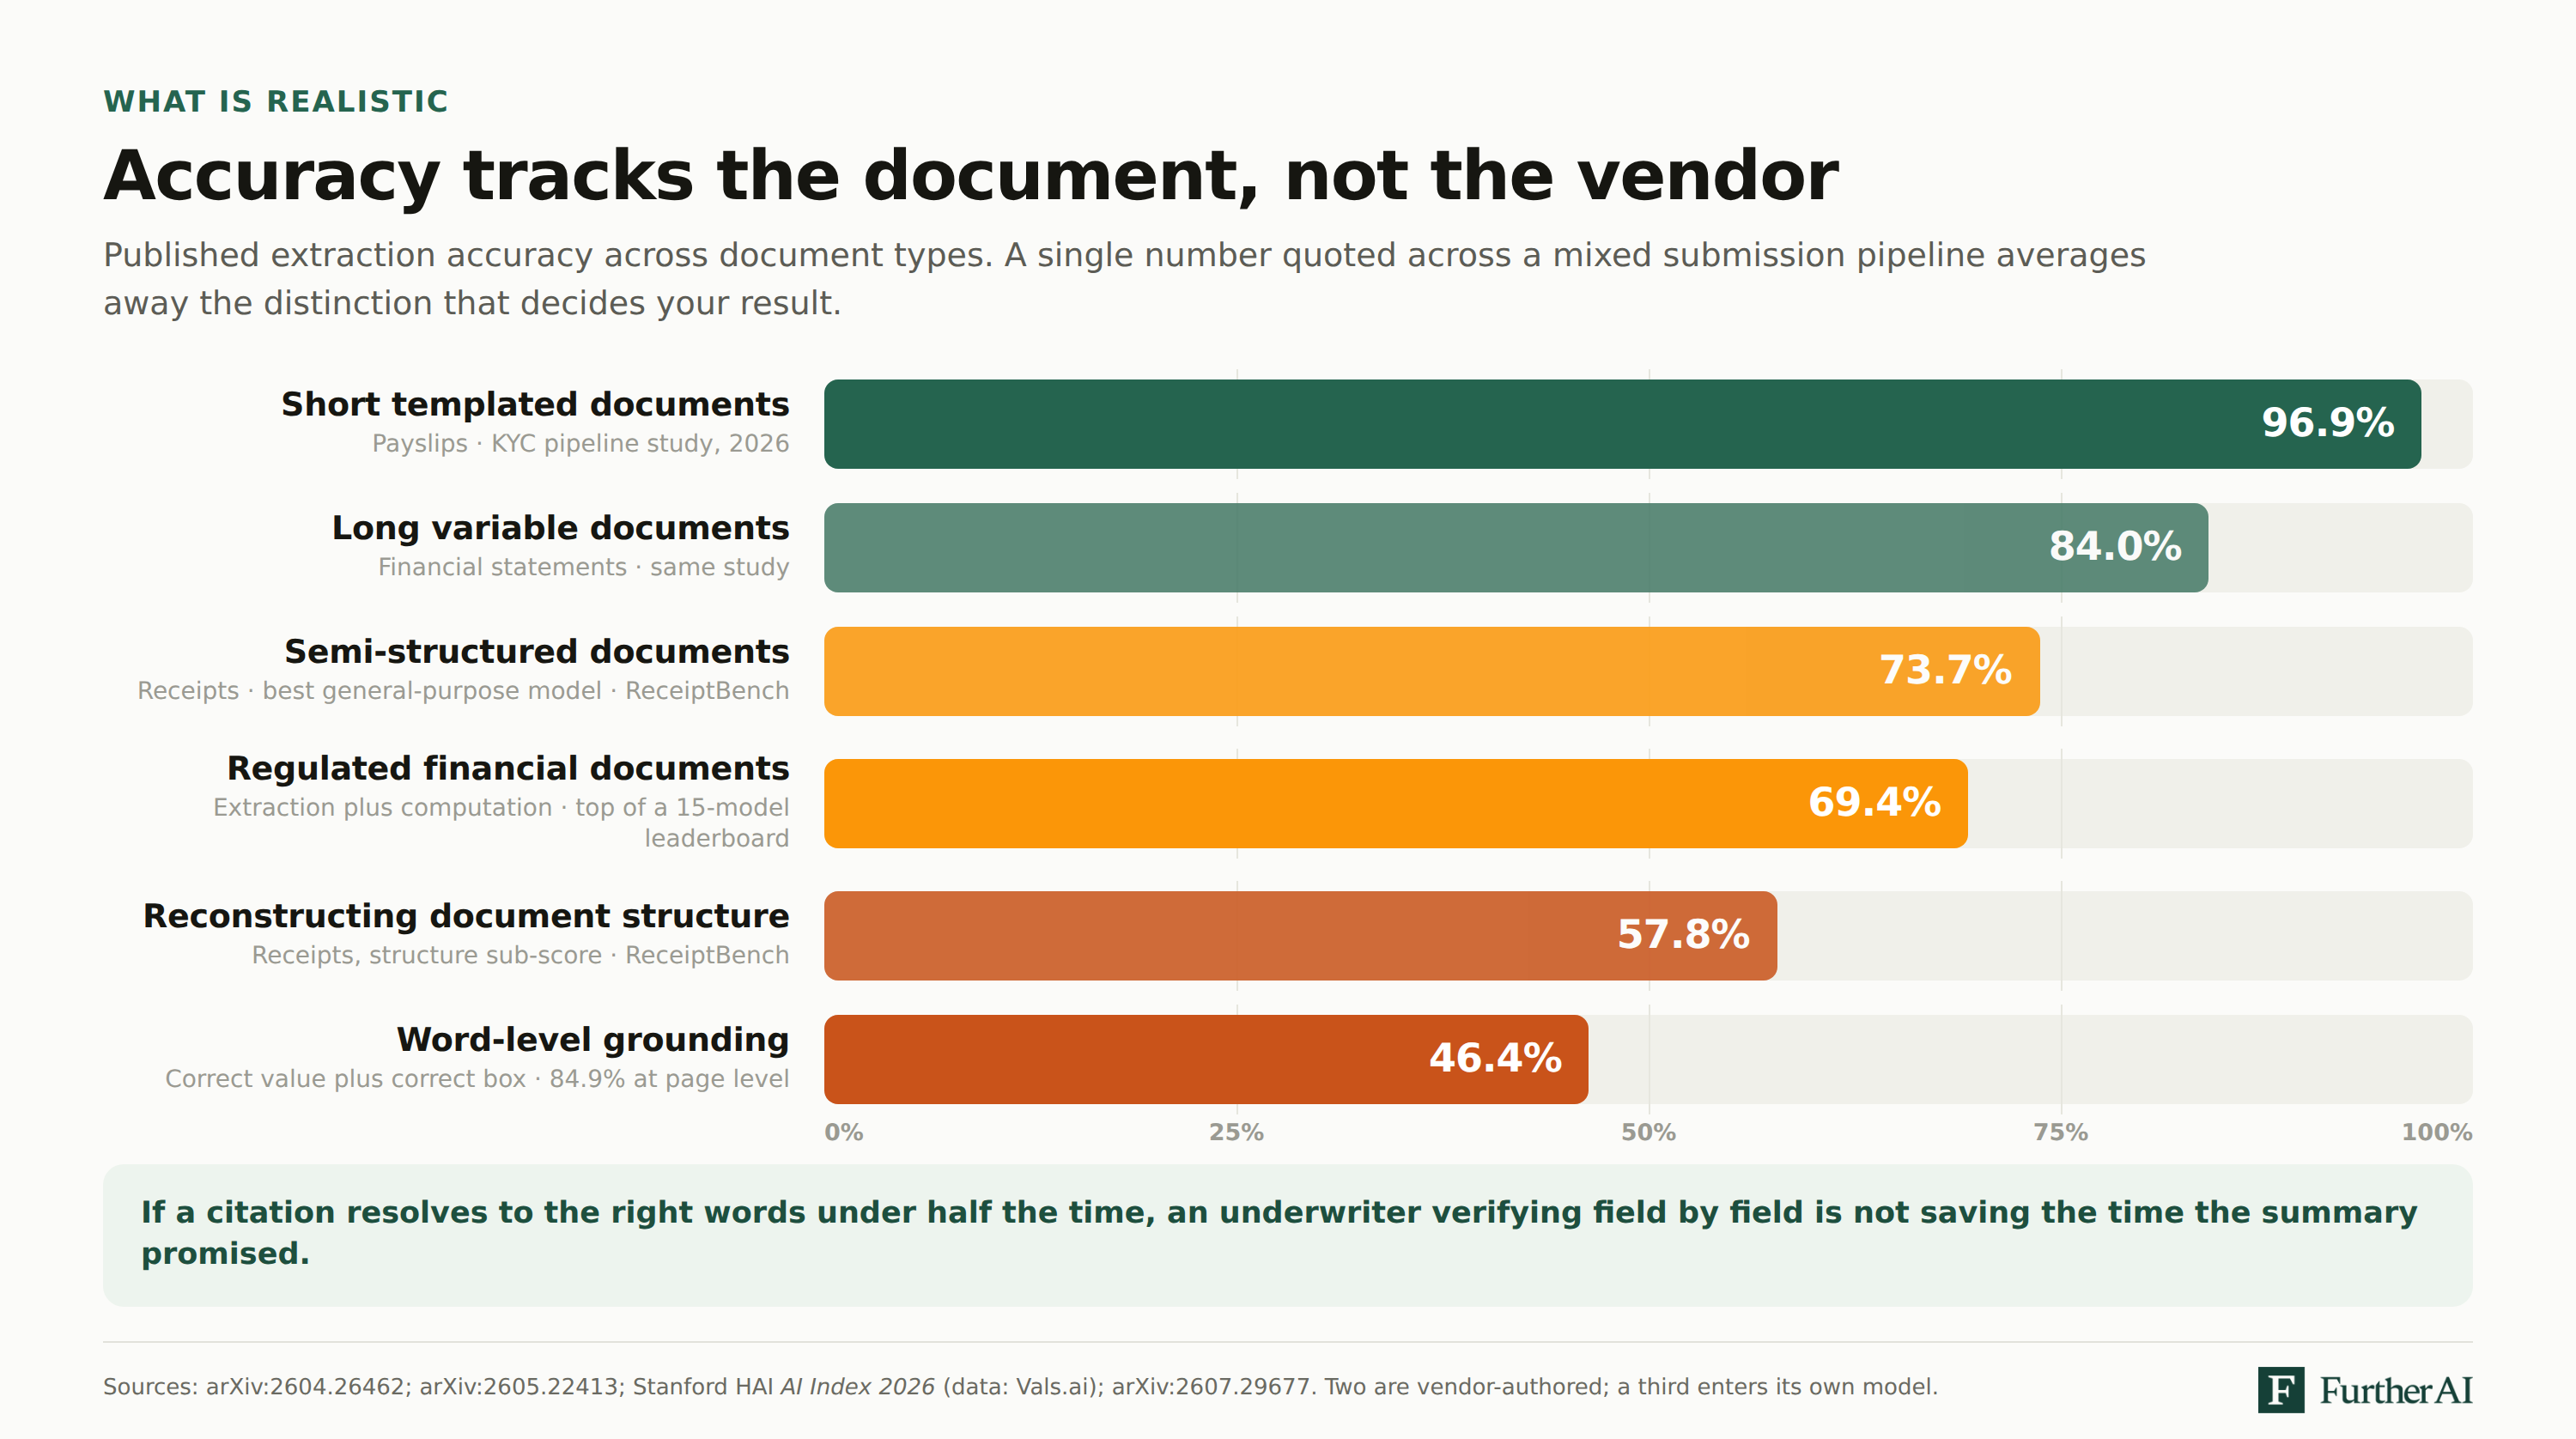
Read the grounding row carefully, because it is the one most often misread. That metric requires a correct value and a correct word-level box, and most systems score zero on it because they return no evidence at all rather than because they point badly. Page-level grounding reaches 84.9%. Either way, if a citation resolves to the right words under half the time, an underwriter verifying field by field is not saving the time the summary promised.
Two other things follow. Templated documents you control are close to solved. Long, variable, scanned documents are not, and anyone quoting a single number across both is averaging away the distinction that matters.
Note who wrote these benchmarks. The KYC pipeline study and the schema-guided benchmark are both authored by teams presenting their own system, and the ReceiptBench authors enter their own fine-tuned model, which wins. MortgageTax, run by Vals.ai and reported through Stanford's AI Index, is the one independent evaluation in the set. None of them is insurance-specific, and no insurance-specific extraction benchmark exists at all. That absence is the reason your own gold set is not optional.
The scorecard
Copy this and fill one row per vendor, per document type.
If a vendor can't fill this in for their own product, that's information too.
How FurtherAI fits
We built Evaluation Studio because the regression problem is real: change a model or a prompt, and things break in ways that aren't obvious. It loads a test set from real submissions out of your own pipeline, returns "an accuracy score against your definition of good, along with the specific cases where something broke," and compares versions side by side before anything reaches production.
Two honest notes on how to use it. Our launch post describes test sets of "typically 50 or 100" submissions, which is well suited to its purpose of catching regressions between versions on identical documents, where sampling noise mostly cancels. For estimating absolute accuracy to a couple of points, the table above applies to us as much as anyone, and you'll want a larger sealed set.
And our published 97% across 32 fields is a per-field number. The arithmetic in this article applies to it. That's the point of publishing the method: ask us for the all-fields-correct rate on your documents, and ask every vendor you're considering the same question. The same method pointed at violation detection rather than field extraction is a different measurement, and we cover compliance AI accuracy separately.
If you want to run this against your own submissions, a demo is the fastest way to start.
Frequently asked questions
REFERENCES
Agresti, Alan, and Brent A. Coull. "Approximate is Better than 'Exact' for Interval Estimation of Binomial Proportions." The American Statistician 52, no. 2 (1998): 119–126. math.unm.edu
Chen, Lingjiao, Matei Zaharia, and James Zou. "How Is ChatGPT's Behavior Changing Over Time?" Harvard Data Science Review 6, no. 2 (2024). hdsr.mitpress.mit.edu
Chinchor, Nancy. "MUC-3 Evaluation Metrics." Proceedings of the Third Message Understanding Conference (MUC-3), 1991, 17–24. aclanthology.org
Chinchor, Nancy, and Beth Sundheim. "MUC-5 Evaluation Metrics." Proceedings of the Fifth Message Understanding Conference (MUC-5), 1993, 69–78. aclanthology.org
Deleger, Louise, Qi Li, Todd Lingren, et al. "Building Gold Standard Corpora for Medical Natural Language Processing Tasks." AMIA Annual Symposium Proceedings 2012: 144–153. pmc.ncbi.nlm.nih.gov
EIOPA. "Opinion on Artificial Intelligence Governance and Risk Management." EIOPA-BoS-25-360, August 6, 2025. eiopa.europa.eu
Ferguson, Nick, Josh Pennington, Narek Beghian, et al. "ExtractBench: A Benchmark and Evaluation Methodology for Complex Structured Extraction." arXiv:2602.12247, February 2026. arxiv.org
FurtherAI. "Complex Property SOV Intake." FurtherAI Customer Stories. furtherai.com
FurtherAI. "FurtherAI Launches Evaluation Studio: Test AI Workflows Before They Hit Production." FurtherAI, 2026. furtherai.com
Han, Yuxuan, Yuanxing Zhang, Yushuo Wang, et al. "A Multistage Extraction Pipeline for Long Scanned Financial Documents: An Empirical Study in Industrial KYC Workflows." arXiv:2604.26462, April 2026. arxiv.org
Islam, Pranab, Anand Kannappan, Douwe Kiela, et al. "FinanceBench: A New Benchmark for Financial Question Answering." arXiv:2311.11944, November 2023. arxiv.org
Kinni, Theodore. "How noisy is your company?" strategy+business, May 19, 2021. strategy-business.com
Krithika, R., J. J. Athanesious, and S. Kiruthika. "Optical character recognition based document image quality assessment." Frontiers in Signal Processing 6 (2026): art. 1779355. frontiersin.org
NIST. "Artificial Intelligence Risk Management Framework (AI RMF 1.0)." NIST AI 100-1, January 2023. nvlpubs.nist.gov
Stanford HAI. "AI Index Report 2026, Chapter 2: Technical Performance." Stanford Institute for Human-Centered AI, 2026. hai.stanford.edu
Wang, Yandi, Libin Zhan, Ziwei Huang, et al. "From Recognition to Reasoning: Benchmarking and Enhancing MLLMs on Real-World Receipt Document Understanding." arXiv:2605.22413, May 2026. arxiv.org
Whittle, Rebecca, Joie Ensor, Lucinda Archer, et al. "Extended sample size calculations for evaluation of prediction models using a threshold for classification." BMC Medical Research Methodology 25 (2025): art. 170. bmcmedresearchmethodol.biomedcentral.com
Zhang, Boyang, Adrian Lyjak, Eli Stewart, et al. "ExtractBench: A Benchmark for Schema-Guided Enterprise Document Extraction." arXiv:2607.29677, July 2026. arxiv.org
DISCLAIMER
This article is for general informational purposes only and does not constitute legal, regulatory, compliance, underwriting, or other professional advice. The content reflects information available as of the date of publication, and FurtherAI undertakes no obligation to update it as laws, regulations, or AI technologies evolve.
Recent posts


Ready to go further and
transform your insurance ops?
Reclaim your time for strategic work and let our AI Assistant handle the busywork. Schedule a demo to see how you can achieve more, faster.




.svg)