

Pinned Analytics: Insights That Stay Where the Work Is

A claims team pulls their monthly breakdown of open claims by cause of loss. Someone spends 20 minutes building the chart, shares it in the review, and the team moves on. Four weeks later, they build the same chart again.
The wasted time is frustrating, but it's not the real problem. The real problem is that the insight had nowhere to live: generated once, used once, and then gone. Most teams have accepted this as the cost of doing business.
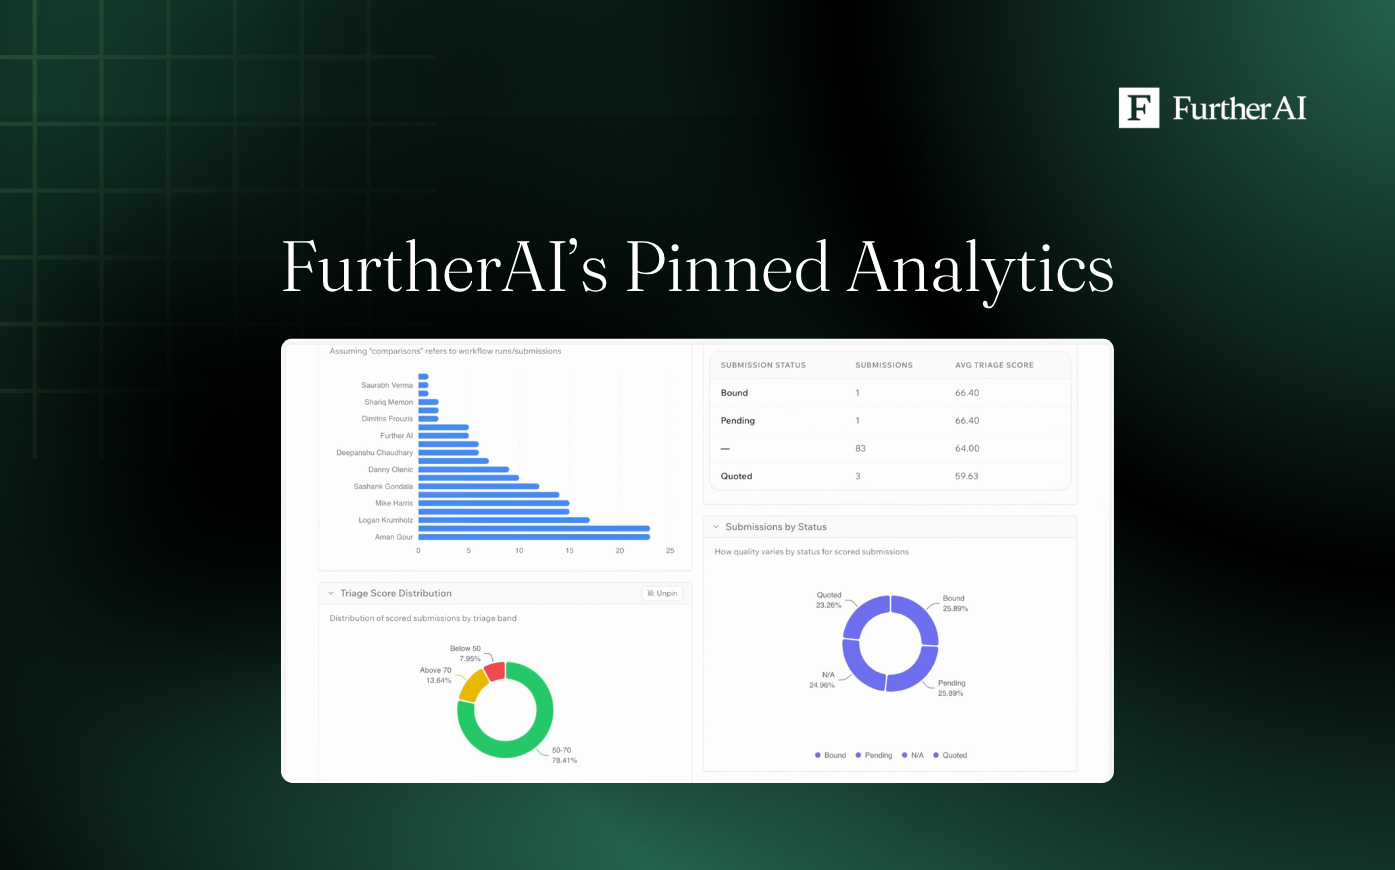
Pin any chart or KPI directly to its workflow
Any chart or KPI your team generates inside FurtherAI's Assistant can now be pinned directly to its workflow, where it lives on the Analytics tab for the team to reference in the future.
When your claims team pulls cause-of-loss data this month, that view is there next month: not rebuilt, re-prompted, or re-explained to someone new. When an underwriting team tracks submission volume by line, the chart is waiting for them at the next review, exactly as they left it. The same insight stays in the same place, and is available every time the team needs it.
Stop losing context every time you create a chart
Context compounds in FurtherAI. Workflows capture reasoning alongside outputs, and decision trails build over time. Pinned Analytics extends that same logic to the metrics your team cares about most, so the data your team has already generated stays visible instead of expiring after a single use.
Before this, revisiting any chart meant starting from scratch: a clean-slate prompt, the same extraction, and the same output. Multiplied across a team and across weekly review cycles, that's a meaningful amount of time spent reproducing work that was already done. More importantly, it's continuity lost, because the analyst who built last month's chart may not be the one rebuilding it this month, and institutional context doesn't transfer through a re-prompt.
Keep insights where the work is
Generate a chart or KPI inside the Assistant, pin it, and it moves to the Analytics tab of that workflow. That makes the chart accessible to everyone working in it without rebuilding anything. The work your underwriters, claims teams, MGAs, brokers, and carriers are doing stays where the work is.
Recent posts


Ready to Go Further &
Transform Your Insurance Ops?
Reclaim your time for strategic work and let our AI Assistant handle the busywork. Schedule a demo to see how you can achieve more, faster.