FurtherAI Available in Microsoft Marketplace
Introducing Connectors



How to Verify Compliance AI Accuracy Before You Buy: An MGA Evaluation Guide (2026)

Under the NAIC's Managing General Agents Act, "the acts of the MGA are considered to be the acts of the insurer on whose behalf it is acting," and an MGA "may be examined as if it were the insurer." A compliance check your software missed is not a software problem, but instead it is your carrier's exam finding, and eventually your binding authority.
So when a vendor says its compliance review is 99% accurate, the useful response is a question: accurate at what, measured how, and on whose documents?
This is how to answer that yourself, before signing. It is the companion to measuring underwriting summary accuracy — that page asks whether a system read the document correctly, while this one asks whether it caught what was wrong.
Key takeaways
- One accuracy number is unfalsifiable by construction. Google's Document AI declines to report accuracy, calling the metric "less meaningful" for documents and substituting F1. Most insurance vendors report exactly that metric, undefined.
- Measure the missed-violation rate, not accuracy. If 3% of your policies contain a violation, a system that flags nothing scores 97%. You can absorb false positives; you cannot absorb false negatives.
- Your pilot is sized by violations, not policies. A 500-policy set at 3% contains 15 of them — too few to tell 90% recall from 98%, because the confidence intervals overlap.
- Eight points of recall is roughly 33 missed violations a year for an MGA writing $150 million in premium. That is the number the pilot exists to estimate.
- Regulators already publish an error threshold: 7% for claims practices, 10% for other trade practices, above which errors are "presumed to indicate a general business practice contrary to these laws."
Why the published numbers can't be checked
Hyperscience states that "customers regularly achieve 99.5% accuracy and 98% automation in their document processing workflows". Convr advertises "91% machine read data accuracy" for a named customer. But in neither cases, it is specified what counts as correct, at what granularity, on how many documents, or who decided the right answer.
Two vendors break the pattern, in opposite directions. Google declines to publish an accuracy figure for Document AI, explaining that the metric "is less meaningful because 1) not all labels appear in the test set... and 2) there may be multiple values for a single label"; it reports precision, recall and F1 instead, computed on your data.
Bevaya, which trades as a dba of Roots Automation, reports results on 346 held-out loss runs with bootstrap confidence intervals — though not the documents themselves, which are client loss runs it cannot release. Its marketing site headlines 98%+ "document extraction accuracy," a field-level figure; on that benchmark, the share of documents with every field correct is 52.9%. Its own engineers explain why the second number is the one that matters: "macro and micro accuracy don't tell you whether any single document is usable."
The standard here is not ours. NIST's AI Risk Management Framework says "accuracy measurements should always be paired with clearly defined and realistic test sets – that are representative of conditions of expected use – and details about test methodology." So a percentage with none of that attached is a claim about nothing in particular.
What to measure instead
Compliance review is a detection problem, and its two error types cost wildly different amounts. A false positive is a clean policy the system flags: it costs a reviewer a few minutes. A false negative is a violation the system passes: it costs you a policy bound outside authority, and it surfaces at a carrier audit or a market conduct exam rather than at your desk. In the classical definitions, precision is the share of flags that are real, recall the share of real violations that were flagged. Recall is the one with teeth, and its complement (the missed-violation rate) is the number to put in the contract.
It also explains why a single accuracy figure actively misleads here. Manning and colleagues put it plainly for skewed data: "A system tuned to maximize accuracy can appear to perform well by simply deeming all documents nonrelevant to all queries."
At a 3% violation rate, flagging nothing scores 97%.
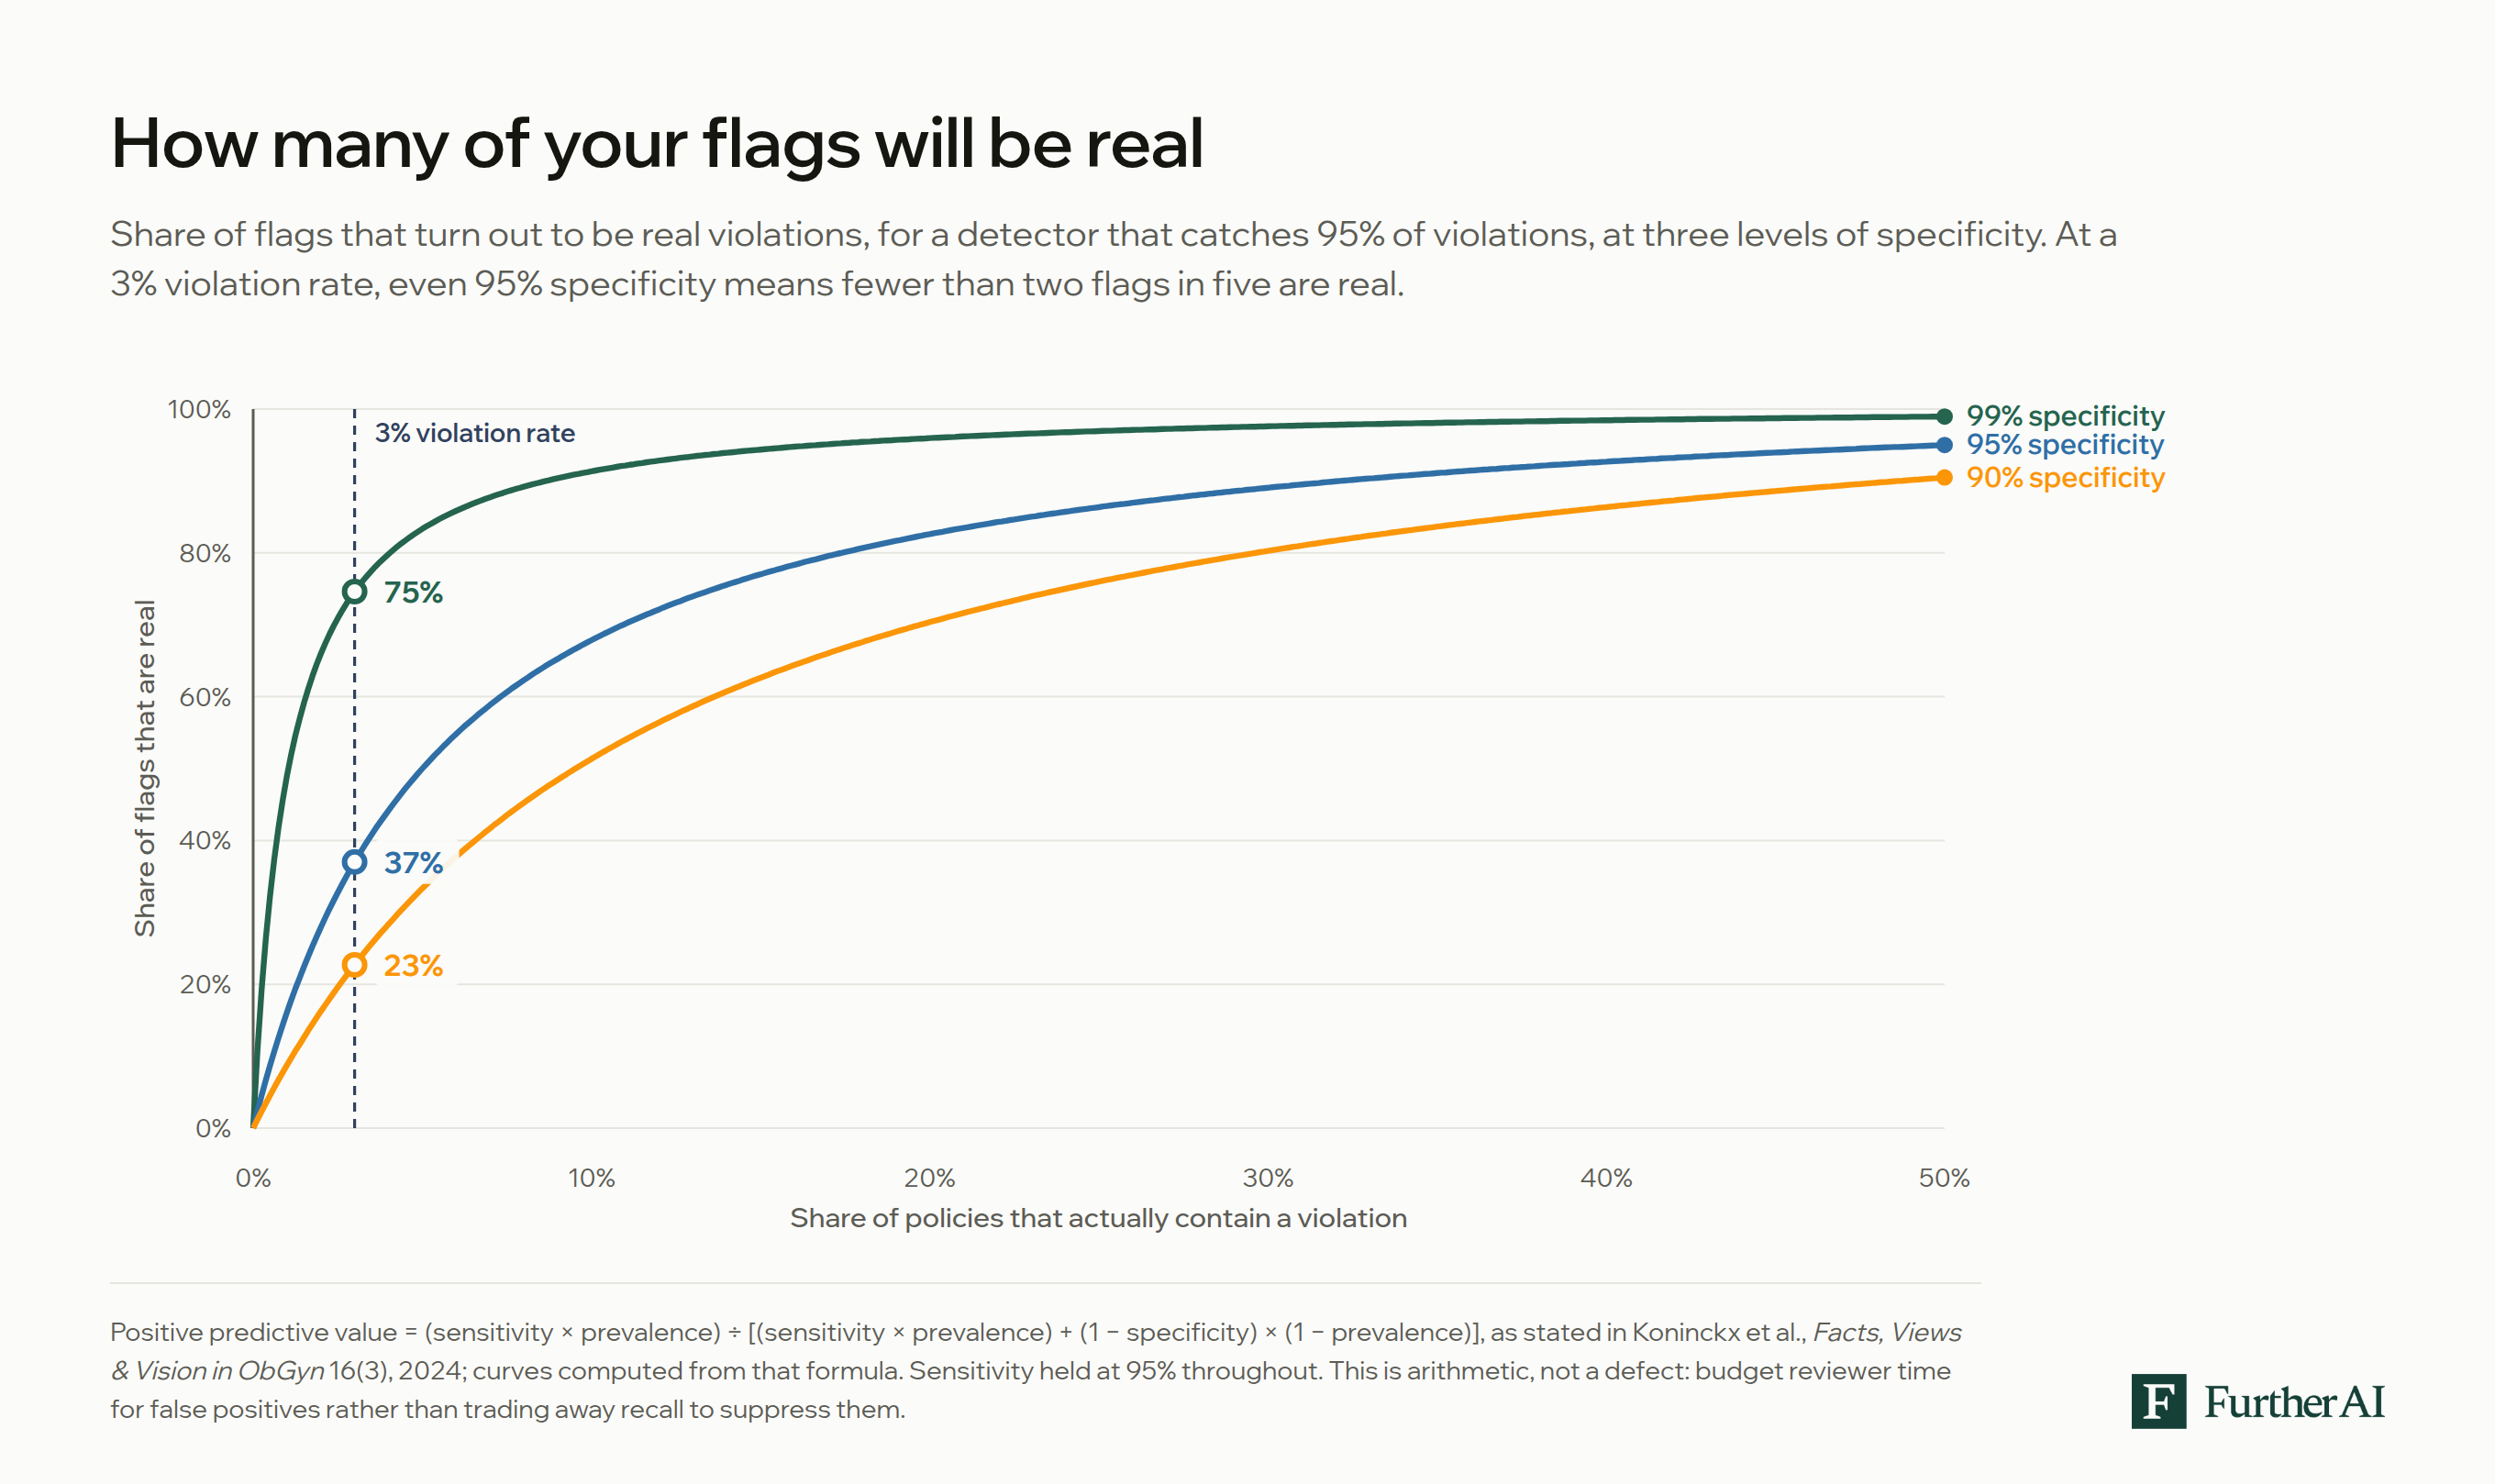
It is worth knowing before the pilot rather than after: at low prevalence, precision collapses even for a good detector. Positive predictive value is sensitivity × prevalence divided by that plus (1 − specificity) × (1 − prevalence), so at 3% prevalence a system with 85% sensitivity and 94% specificity returns about 30%. Two flags in three will be clean policies — arithmetic, not failure, and why precision and recall diverge on imbalanced data. Budget reviewer time for it, and don't let a vendor raise precision by tightening thresholds, because that comes straight out of recall.
Build the gold set from your own bound policies
No insurance-specific benchmark for compliance detection exists, and your book is the only test set that predicts your results.
Pull bound policies from the last 12 months, stratified by program, state and carrier — the dimensions your rules vary along. Then record the correct answer for each: every violation present, the rule it breaches, where it sits in the document. Two reviewers label independently and a third adjudicates, because a label set one person produced alone is that person's opinion, and accuracy measured against a noisy label is depressed for every vendor alike.
Only then do you seed. Natural violations are too rare to measure against, for reasons the next section makes precise, so construct additional cases by modifying clean policies in ways your compliance team recognises: the endorsement that should have been attached and wasn't, the limit above the program maximum, the state form that was omitted. Record exactly what you seeded. Like build vs buy underwriting automation, the cost of doing this properly is real and smaller than the cost of finding out in production.
Size the pilot by violations instead of policies
This is where most evaluations tend to fail. A 500-policy gold set sounds rigorous, but at a 3% violation rate it contains 15 violations — and 15 is the number that determines what you can conclude.
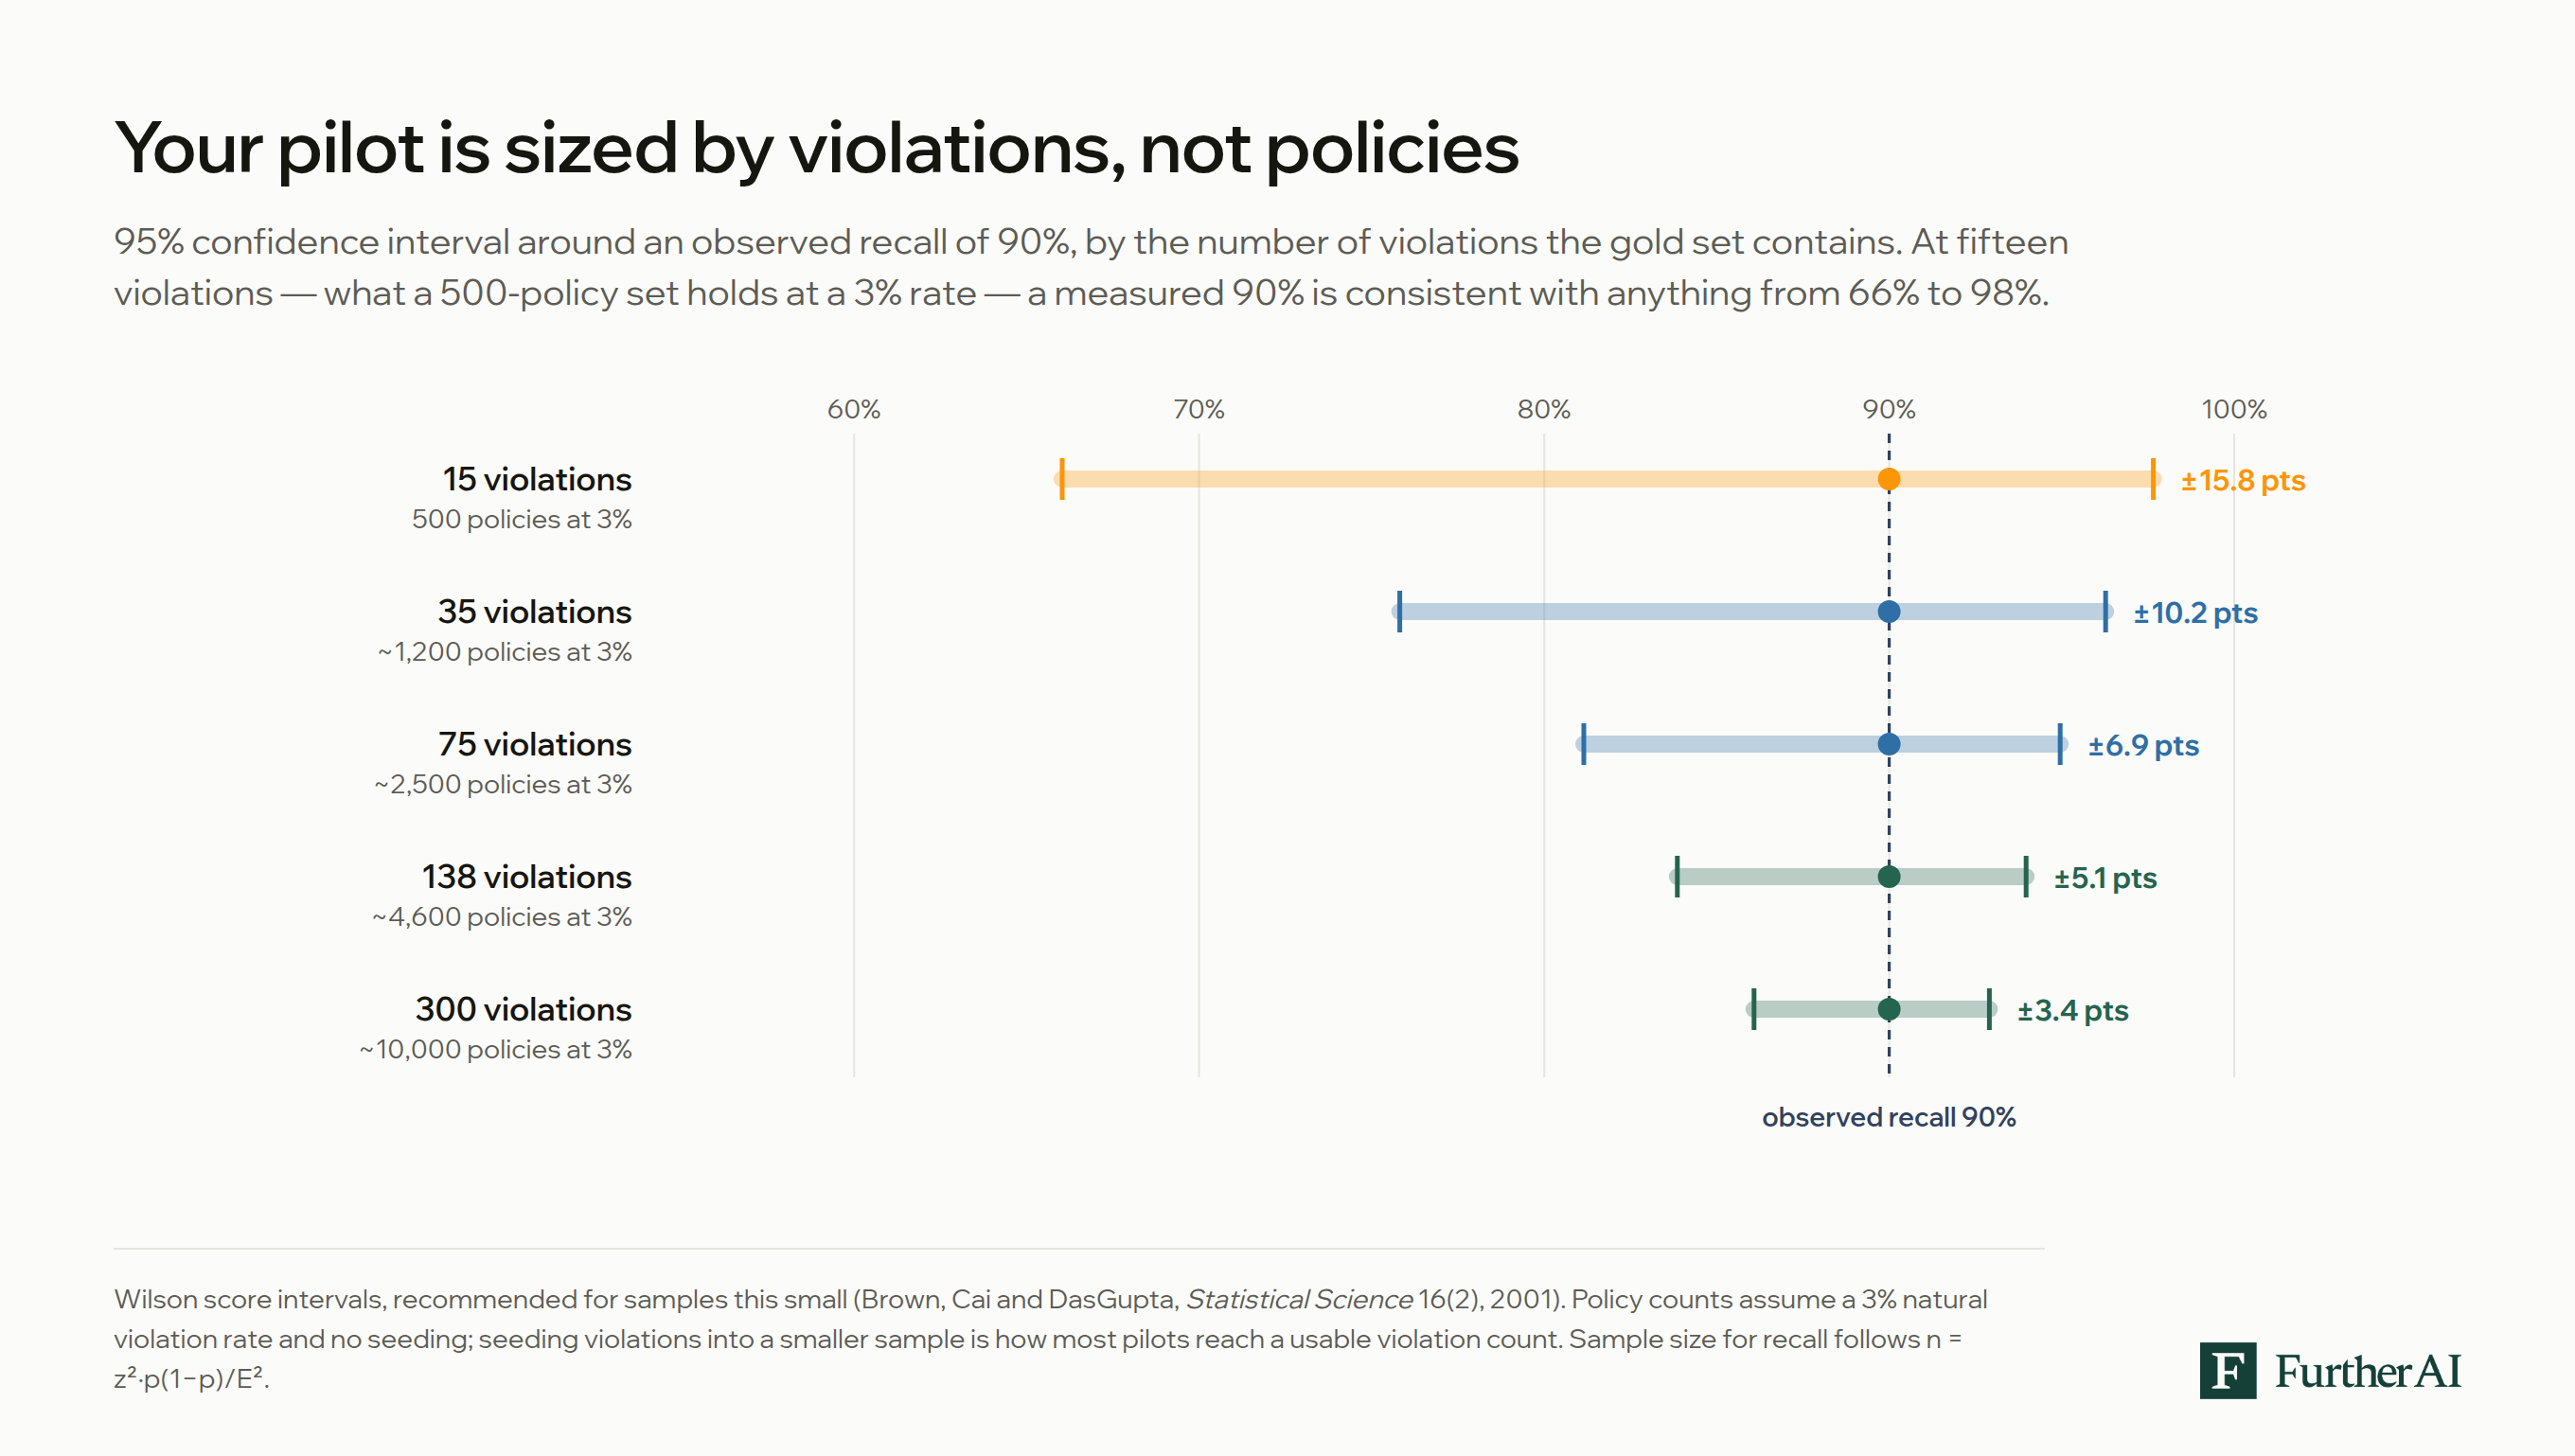
Take the two systems concretely. One at 90% recall catches 14 of those 15 and misses one; one at 98% catches all 15. Using the Wilson score interval — recommended for samples this small, where the textbook Wald interval is unusable — 14 of 15 gives a 95% confidence interval of 70.2% to 98.8%, and 15 of 15 gives 79.6% to 100%. They overlap almost entirely. A 500-policy pilot cannot tell the two apart.
The sample size for a proportion is n = z²·p(1−p)/E², and applied to recall it depends only on the violation count: about 138 violations to pin recall near 90% to within ±5 points, 35 for ±10. Because sensitivity is estimated only on positive cases, the same source gives n_Sens = z²·Sens(1−Sens)/(E²·P) — so at 3% prevalence, reaching 138 violations by random sampling means pulling roughly 4,600 policies. That inflation is the whole argument for seeding.
And if a system misses nothing at all, the rule of three says zero events in n observations bounds the true rate at 3/n with 95% confidence. Zero misses across 15 violations bounds the miss rate at 20%; across 138, at 2.2%. A perfect score on a small set is close to no information.
What eight points of recall costs
Convert it to your book. The Florida Surplus Lines Service Office reported an average 2025 premium of $10,831 per commercial general liability policy in Florida's surplus lines market, so an MGA writing $150 million of comparable business binds roughly 13,800 policies a year — about 415 violations passing through annually at a 3% rate.
At 90% recall, 42 reach a bound policy uncaught. At 98%, eight do. The difference between two vendors whose decks both round to "99% accurate" is roughly 33 missed violations a year — and the 500-policy pilot could not have told them apart.
Is 3% realistic? It is conservative. A 2025 Texas market conduct exam of a carrier using an MGA found that in 35% of policies reviewed, agents on the declarations page were not appointed to issue or service them. The carrier paid $150,000, in part for failing to perform its required 2022 annual audit of that MGA.
Score the pilot
Run every system on identical inputs, keeping part of the gold set sealed so nothing is tuned to it. Report, per program and per violation type:
- Recall, with its Wilson interval. A point estimate alone is not a result.
- The missed violations themselves. Read every one. Missing hard cases evenly is a performance gap; missing an entire rule type is a coverage gap.
- Precision, and the flag volume it implies — in reviewer-hours per thousand policies, not as a percentage.
- Seeded and natural cases scored separately. If they diverge sharply, your seeds are unrealistic and the estimate is soft.
- Whether each flag cites its evidence — clause and page. An unsourced flag is a second review, not a finished one.
The NAIC's Market Regulation Handbook treats an error rate above 7% for claims practices or 10% for other trade practices as "presumed to indicate a general business practice contrary to these laws" — the standard your output faces whether a person or a model produced it.
Questions that separate an evaluation from a demo
- What is your recall on violations, and on how many? If the answer is an accuracy percentage, ask again.
- Who labelled your ground truth, and did two people label independently?
- Show me your five worst misses. A vendor who cannot has not looked.
- What happens to recall when I tighten precision? There is a trade. A vendor who denies it has not measured it.
- Can we run this on our own documents, before contracting?
- What contractually triggers a re-test? Models change. Tie re-measurement to any model or pipeline change.
The scorecard
If a vendor cannot fill this in for their own product, that is information too. Copy this and fill one column per vendor, per program.
How FurtherAI fits
Evaluation Studio exists for this loop: testing AI workflows before production by loading a test set built from your own submissions, defining what good looks like, and comparing versions side by side before anything ships.
Two caveats, by this article's own standard. Our launch post describes test sets of "typically 50 or 100", which is good for catching regressions between versions, below the violation counts above for estimating absolute recall. And we published no compliance-detection recall figure. So we are not asking you to take one on faith, but rather to measure ours the way this page describes, on your policies.
Frequently asked questions
REFERENCES
Bevaya Labs. "The Case for Specialization." Ben Elliott, Hunter Heidenreich and Ratish Dalvi, 16 September 2026. labs.bevaya.ai
"Interval Estimation for a Binomial Proportion." Statistical Science 16, no. 2 (2001): 101–133, with discussion. repository.upenn.edu
Convr. Homepage. convr.com
Florida Surplus Lines Service Office. 2025 Annual Report. fslso.com
Google Cloud. "Evaluate and tune a processor version." Document AI documentation. cloud.google.com
Hanley, James A., and Abby Lippman-Hand. "If Nothing Goes Wrong, Is Everything All Right? Interpreting Zero Numerators." JAMA 249, no. 13 (1983): 1743–1745. jhanley.biostat.mcgill.ca
Hyperscience. "Hypercell for Document Automation." hyperscience.ai
Koninckx, P.R., A. Ussia, B. Amro, A. Wattiez, and L. Adamyan. "Letter to the Editor." Facts, Views & Vision in ObGyn 16, no. 3 (2024): 375–376. europepmc.org
Manning, Christopher D., Prabhakar Raghavan, and Hinrich Schütze. Introduction to Information Retrieval. Cambridge University Press, 2008. nlp.stanford.edu
Monti, Caterina Beatrice, Federico Ambrogi, et al. "Sample size calculation for data reliability and diagnostic performance: a go-to review." European Radiology Experimental 8, no. 74 (2024). eurradiolexp.springeropen.com
National Association of Insurance Commissioners. Managing General Agents Act. Model #225. content.naic.org
National Association of Insurance Commissioners. Market Regulation Handbook, Volume I (2017 ed.), the most recent publicly accessible text. secure.in.gov
National Institute of Standards and Technology. Artificial Intelligence Risk Management Framework (AI RMF 1.0). NIST AI 100-1, January 2023. nvlpubs.nist.gov
Saito, Takaya, and Marc Rehmsmeier. "The Precision-Recall Plot Is More Informative than the ROC Plot When Evaluating Binary Classifiers on Imbalanced Datasets." PLOS ONE 10, no. 3 (2015): e0118432. journals.plos.org
Texas Department of Insurance. Official Order of the Commissioner of Insurance No. 2025-9264, In re First Chicago Insurance Company. 17 April 2025. tdi.texas.gov
DISCLAIMER
This article is for general informational purposes only and does not constitute legal, regulatory, compliance, underwriting, or other professional advice. The content reflects information available as of the date of publication, and FurtherAI undertakes no obligation to update it as laws, regulations, or AI technologies evolve.
Recent posts
Ready to go further and
transform your insurance ops?
Reclaim your time for strategic work and let our AI Assistant handle the busywork. Schedule a demo to see how you can achieve more, faster.




.svg)